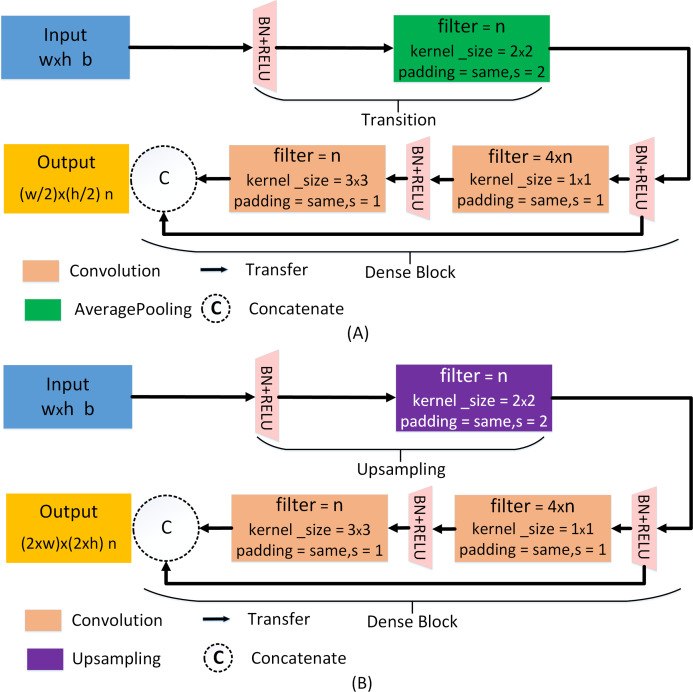
Figure 5. Dense network for encoder and decoder pipelines.
(A) The dense network of the encoder pipeline. (B) The dense network of the decoder pipeline. Here, w, h, b, s, and n correspond to the width and height of the input, the number of channels, the step size of the pooling operation, and the number of filtering operations performed by each layer, respectively. For layers 6, 5, 4, 3, 2, 1, the values of n are 512, 512, 256, 128, 64, and 32, respectively.

