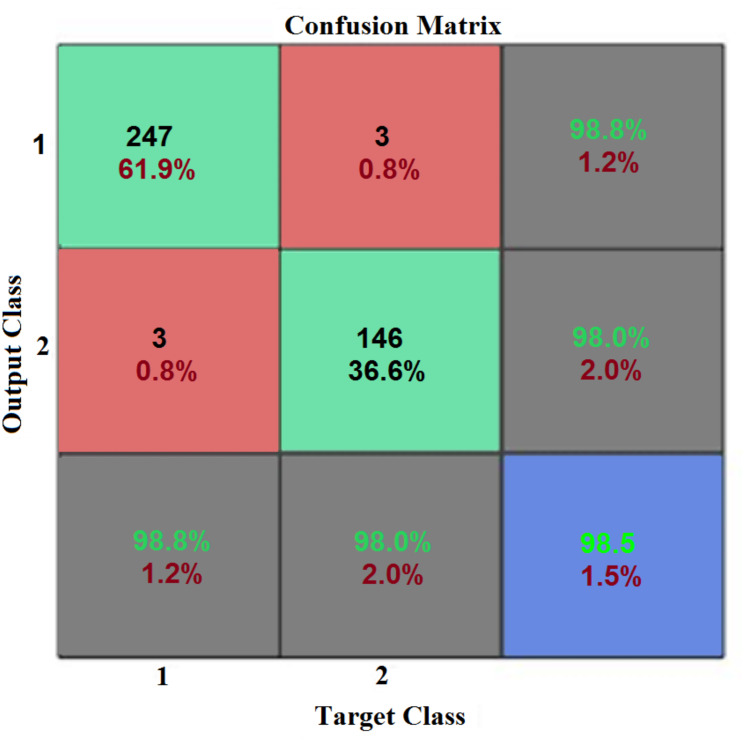
Figure 8. Performance confusion matrix (CM).
This CM is computed for the performance of the training dataset. The first two rows and first two columns represent the actual confusion matrix. While, the third row and third column are the summary of percentage accuracy, and sensitivity and specificity, respectively.

