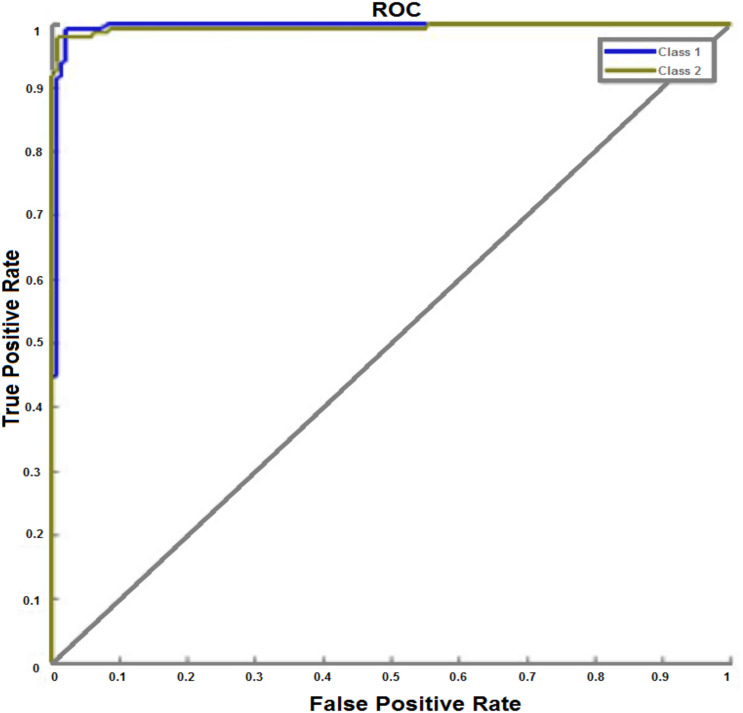
Figure 9. Receiver operating characteristic (ROC) curve.
The ROC plot represents the performance of the binary classification system for the training dataset. The graph is formed by plotting the true positive rate (TPR) against the false positive rate (FPR). This figure shows the best performance for the proposed IANN which is achieved at iteration 26.

