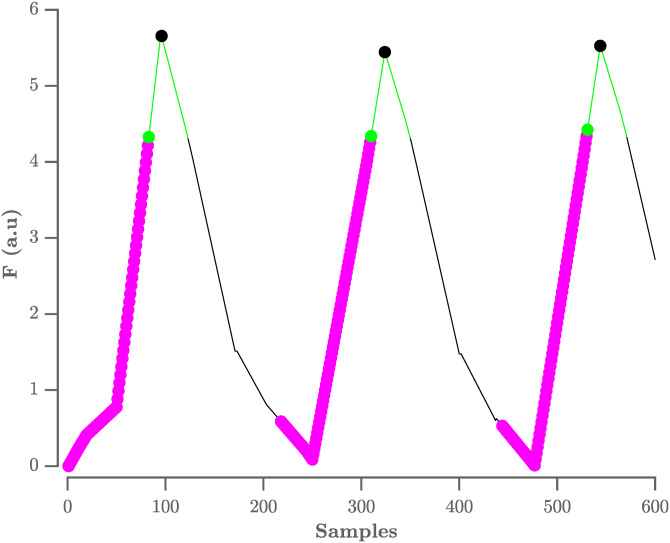
Figure 3. Procedure to select R-peaks.
The resulting flat ECG denoted F is indicated by the black line. The samples with an amplitude lower than the sample 80 ms further are indicated by the magenta circles, with the last sample indicated by the green circle. The search window is indicated by the green line. The selected R-peaks are indicated by the black circles. A.u. stands for arbitrary units.

