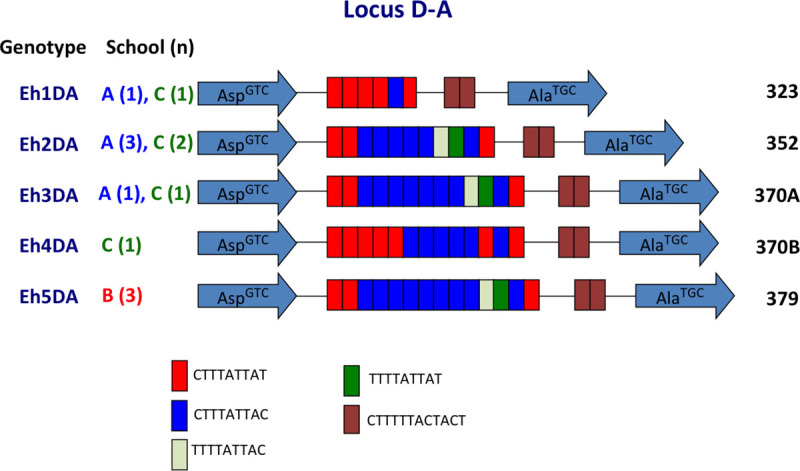
Fig 3. Schematic representation of tRNA-linked STR fragments at the D-A locus in E. histolytica.

Numbers in parentheses indicate the number of samples with each genotype from each school. Numbers on the far right show the length of fragments excluding the primer sequences.
