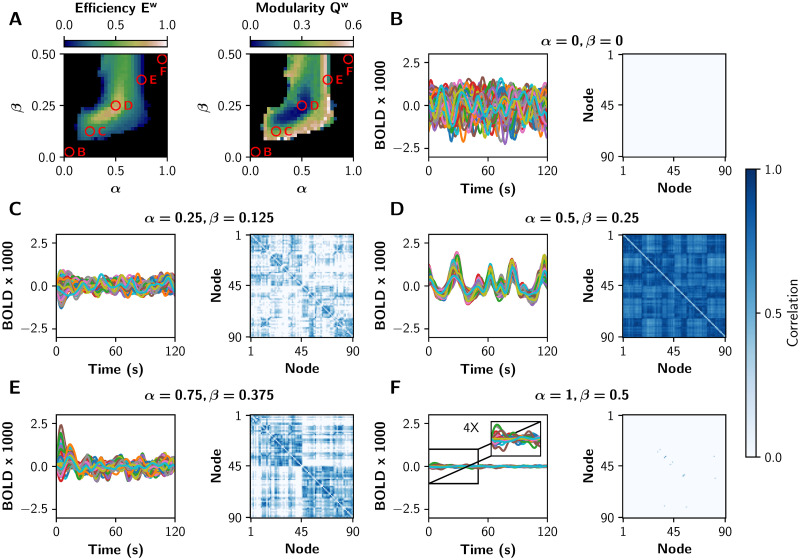
Fig 3. fMRI-like sFCs at different values of α and β.
A) The red circles represent pairs of (α, β) values in which different integration/segregation profiles can be observed. B-F) BOLD-like signals, and their respective sFC matrices, for the (α, β) values shown in A. The sFC networks evolve from neither integration nor segregation (B, the nodes are disconnected), to a more integrated sFC (C). In D the integration is maximal, and a further increase of both parameters produces a more segregated sFC matrix (E). Finally, in F there is neither integration nor segregation (the pyramidal neurons are over-excited). We shown only 120 s of BOLD-like signals, while sFC matrices were built with the full-length time series (600 s).

