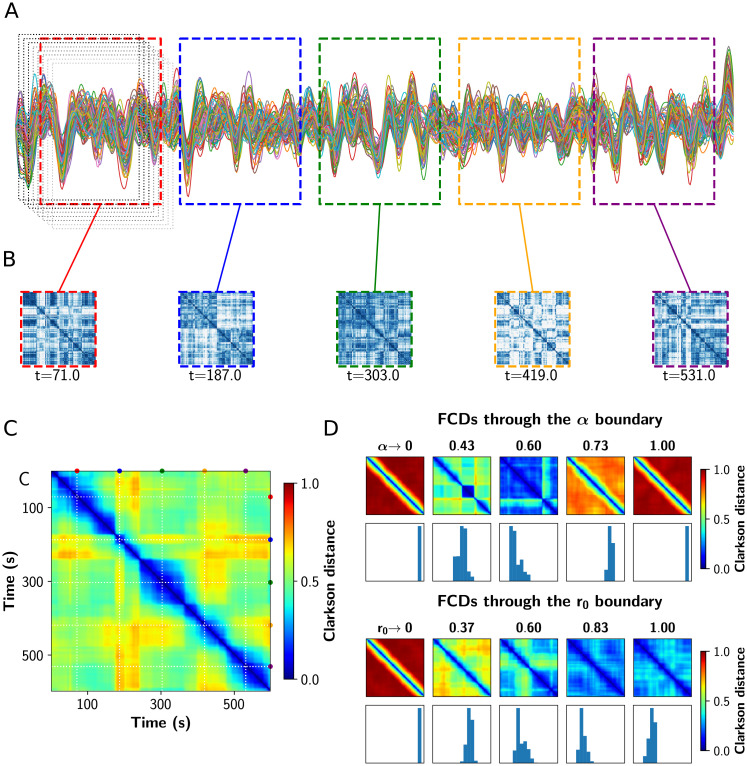
Fig 6. Analysis of functional connectivity dynamics.
A) Sample fMRI BOLD time series showing the fixed length and overlapping time windows at the begginging. In color, the time windows corresponding to the FCs shown in B. B) FC matrices obtained in the colored time windows. C) Functional Connectivity Dynamics (FCD) matrix, where all the FCs obtained were vectorized and then compared against each other using a vector-based distance (Clarkson distance). D) FCD matrices through the critical boundary, in both α and r0 direction. Below each FCD, a histogram of its upper triangular values is shown. The variance of these values constitutes a measure of multistability.

