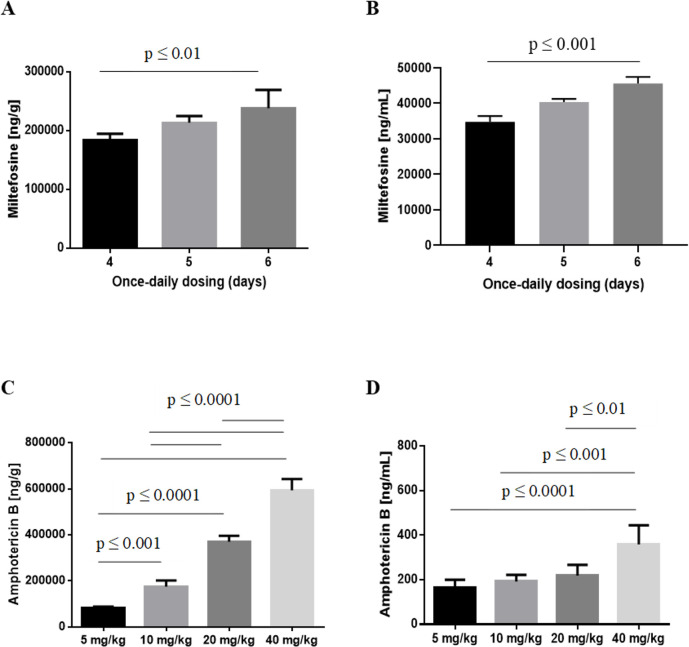
Fig 3. Drug concentrations in plasma and liver following administration of repeated dose miltefosine and single dose AmBisome.
Drug concentrations in livers (A, C) and plasma (B, D) were measured in the same animals for which dose response data is given in Fig 1. Columns represent group means and error bars standard deviations, following treatment with 30 mg/kg miltefosine (n = 5; A, B) or different doses of AmBisome, as indicated (n = 6; C, D).

