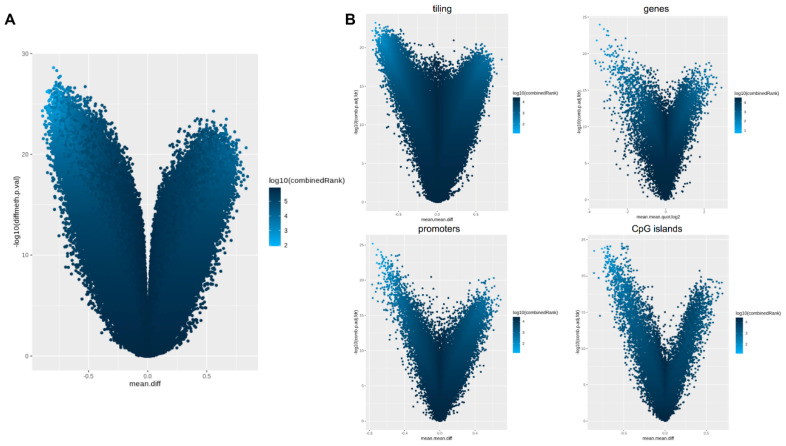
Figure 4.
Methylation-profiling array: Volcano plot for differential methylation in 10 pregnancies (cases 1–10). (A) Volcano plot for differential methylation in CpG sites, quantified using methylation score differences between cord blood and placenta (x-axis) and the p-value of each region (y-axis). Points identify differentially methylated sites that are hypermethylated in placenta (left portion of the plots) or hypermethylated in cord blood (right portion of the plots). Color scale is based on a combined ranking. (B) Volcano plots for differential methylation in tiling, genes, promoters, and CpG islands.

