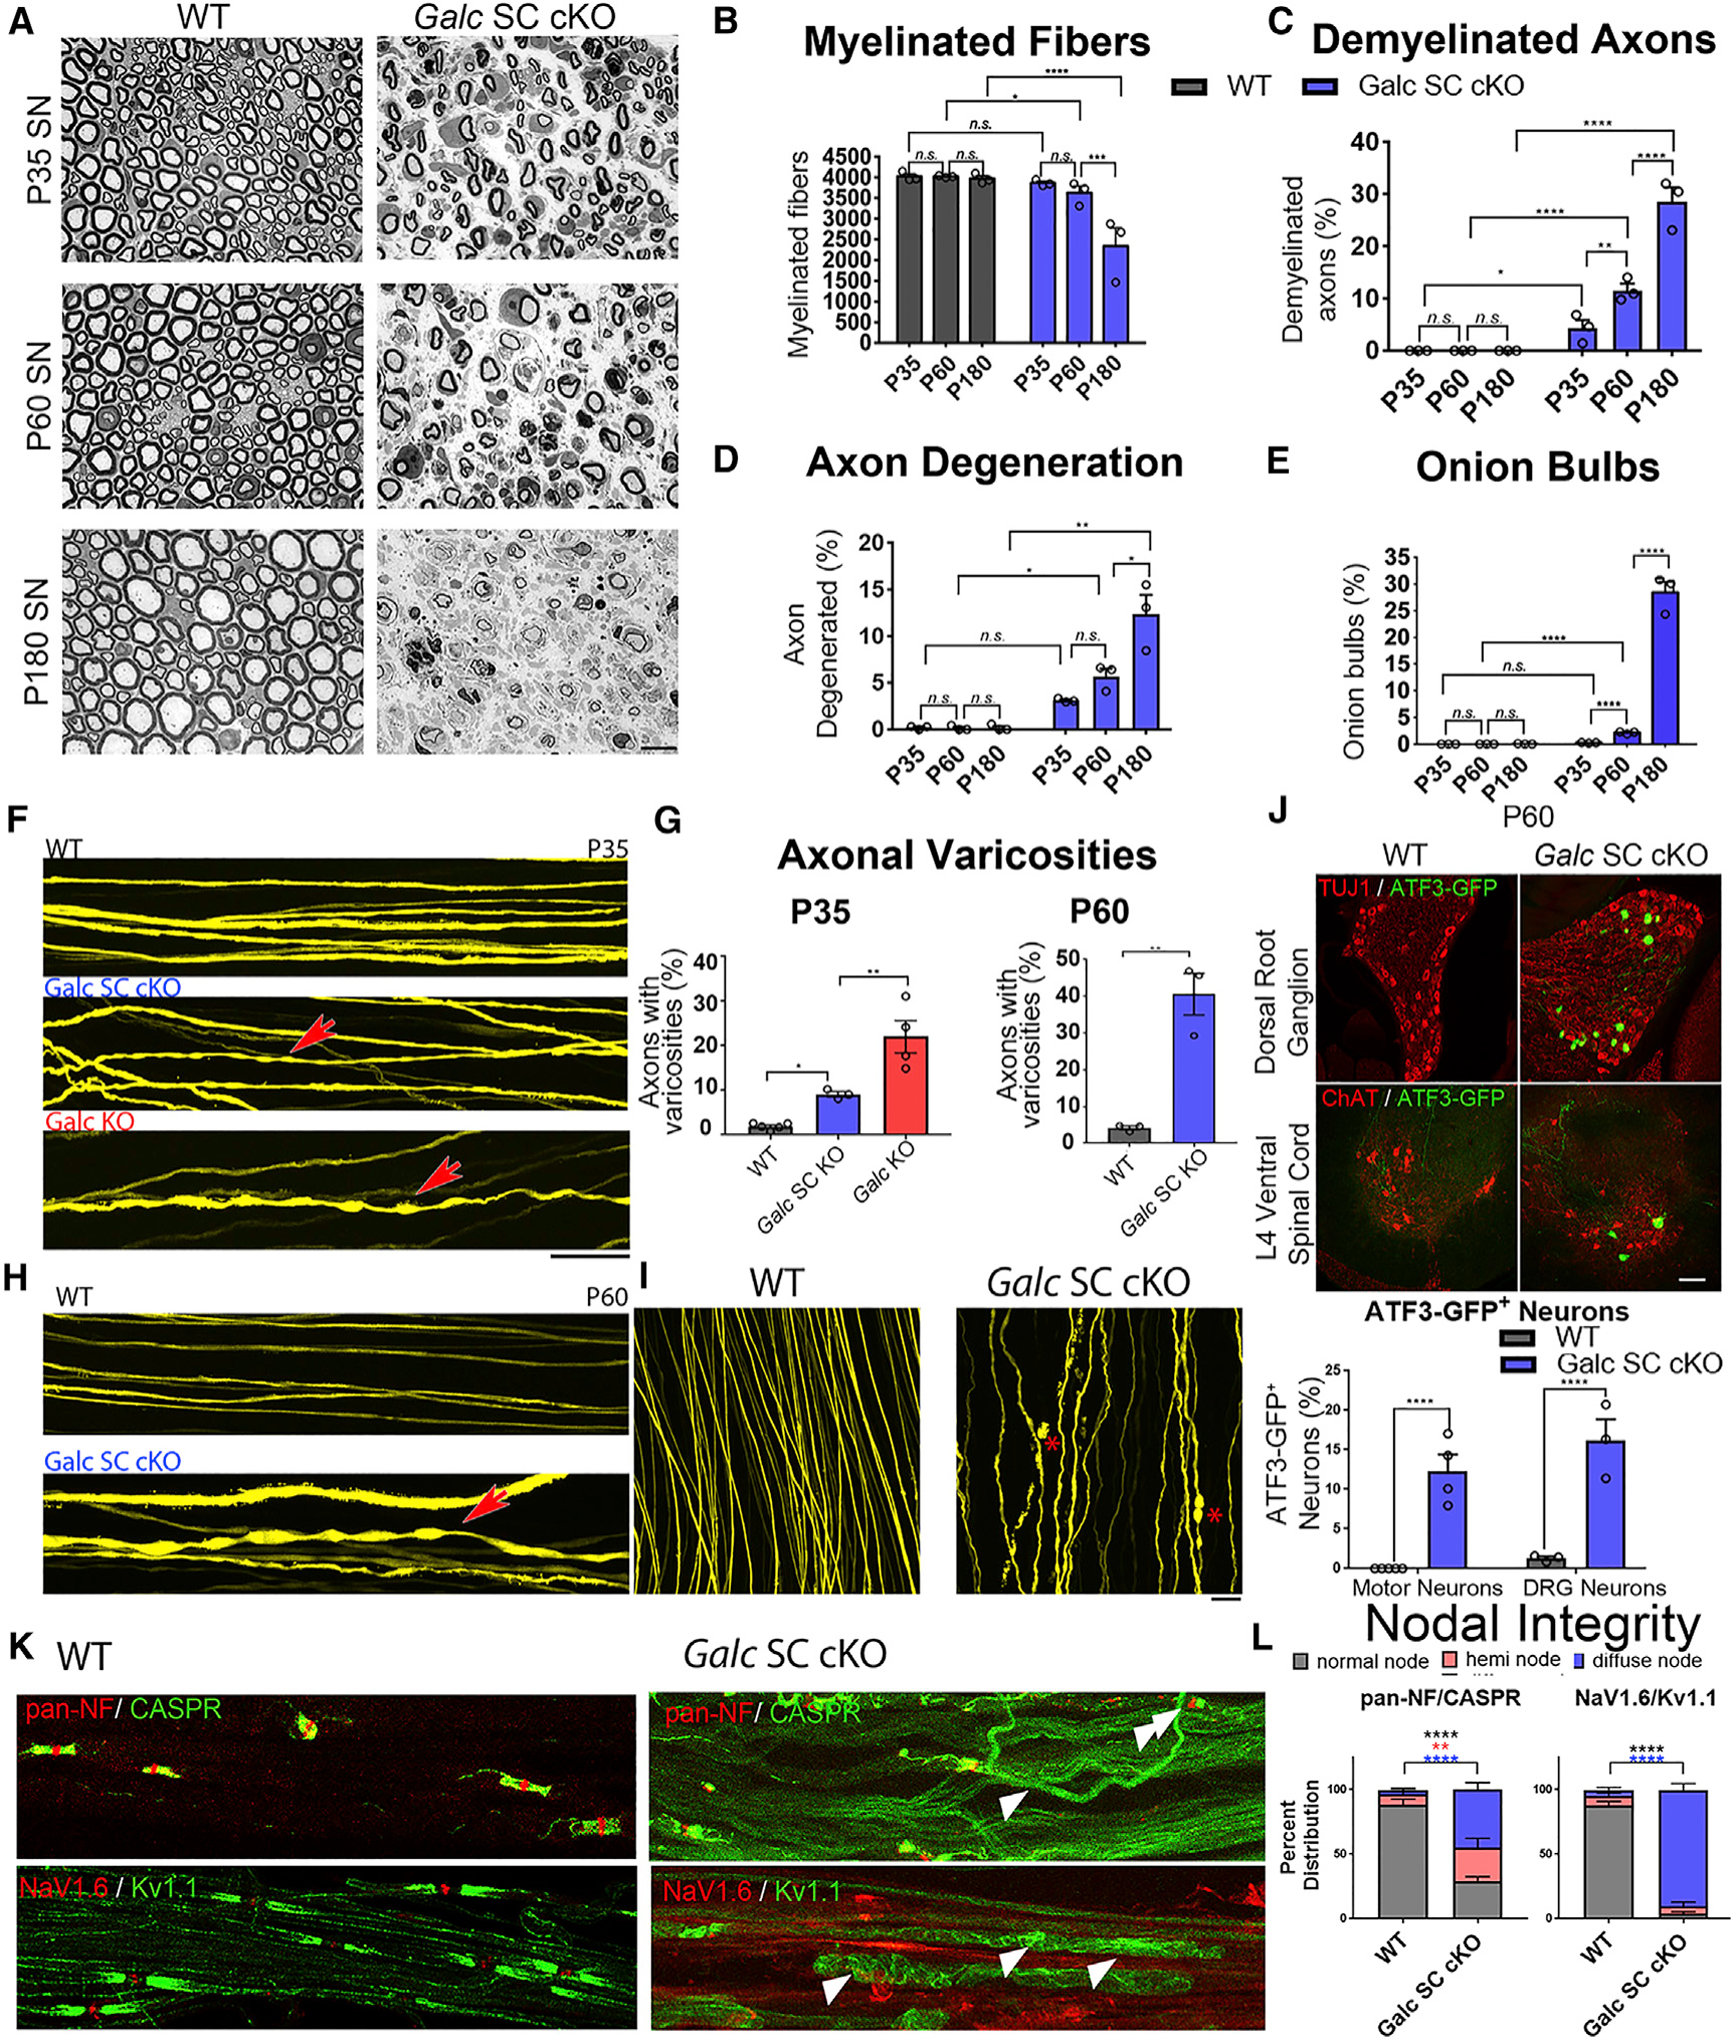
Figure 4. Deletion of Galc in Schwann Cells Causes a Progressive Demyelinating Neuropathy and Axonal Degeneration.

(A) Semithin sections of sciatic nerve from P35, P60, and P180.
(B) Quantification of myelinated fibers in sciatic nerves of WT and Galc SC cKO at different ages.
(C) Percent of demyelinated axons in the sciatic nerves of WT and Galc SC cKO at different ages.
(D) Percent of degenerating axons in the sciatic nerves of WT and Galc SC cKO at different ages.
(E) Percent of fibers with onion bulbs in the sciatic nerves of WT and Galc SC cKO at different ages. (F) Thy1-YFP labelled axons of P35 sciatic nerve for the genotype indicated. Red arrow shows varicosities indicative of axonopathy.
(G) Quantification of varicosities (from F, left and H, right).
(H) Thy1-YFP labelled axons of P60 sciatic nerve in WT and Galc SC cKO nerves.
(I) P60 Thy1-YFP labelled axons showing examples of axon degeneration in Galc SC cKO, indicated by asterisk (red).
(J) ATF3-GFP expression and quantification in P60 DRG neurons or motor neurons.
(K) Evaluation of nodal integrity in sciatic nerve teased fibers stained with antibodies to the nodal and paranodal proteins Neurofascins (pan-NF, red); the paranodal protein Caspr (green), the nodal voltage-gated sodium channel NaV1.6 (red), and the juxtaparanodal potassium channel KV1.1 (green). Arrowheads point to fibers with abnormal diffuse localization of proteins, and double arrowheads point to heminodes.
(L) Quantification of (K).
Scale bars, 10 μm, 100 μm(F and H), and 40 μm(I). Error bars represent mean ± SEM, n = 3 biological replicates and 3 technical replicates per experiment (n = 4 for J). Statistical significance was calculated by two-way ANOVA (B–E), one-way ANOVA (P35, G), or Student’s t test (P60 G, J, and L).
