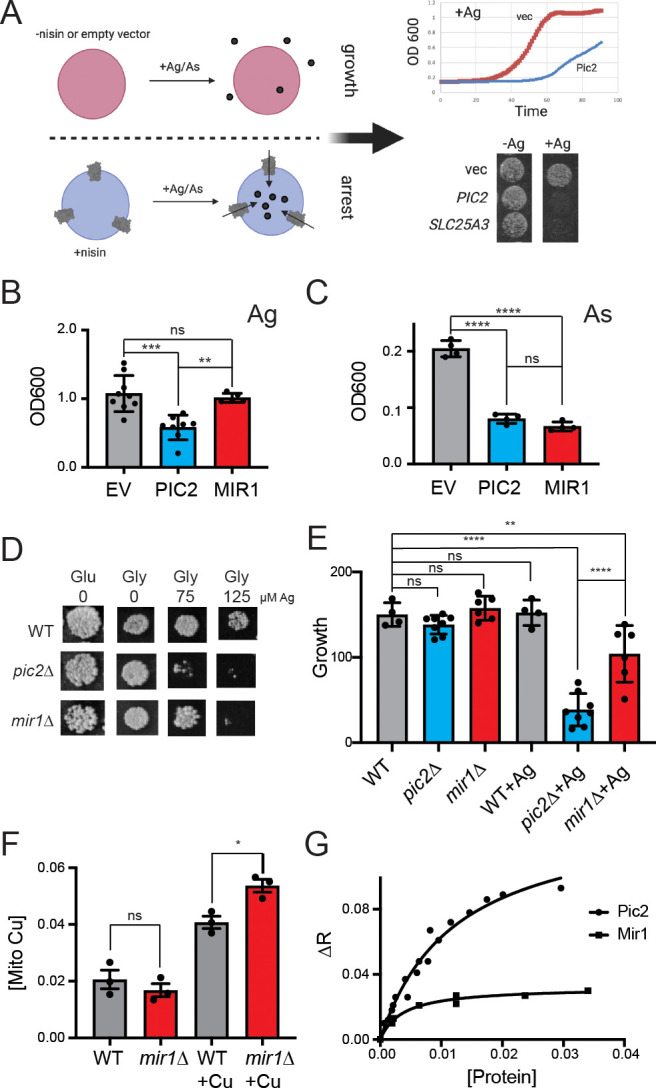
Figure 1. S.cerevisiae MIR1 does not transport Cu.

(A) Schematic representation of the L. lactis expression system used to quantify transport characteristics. Survival is determined by the growth rate in liquid culture or by visual inspection of cells grown on agar plates containing Ag+ or AsO43− in the presence of the inducer nisin. (B) Quantification of the growth of L. lactis expressing empty vector (EV), S. cerevisiae PIC2, or S. cerevisiae MIR1 after 12 hr in 80 µM Ag+-containing media (n > 5). (C) Quantification of the growth of L. lactis expressing EV, PIC2, or MIR1 after 12 hr in 1.6 mM AsO43−-containing media (n = 5). (D) Wild-type (WT), pic2∆, or mir1∆ yeast grown in rich medium with a fermentable (Glu: glucose) or a non-fermentable (glycerol: Gly) carbon source in the absence (0) or presence of Ag+ (75 or 125 µM). All strains were spotted on media as a 10−3 dilution of OD600 of 1. (E) Densitometry measurements of serial dilutions (10, 102, 103, 104) of cells in D on Glu, Gly, and Gly plus 75 µM Ag (WT n = 4, pic2∆ n = 8, mir1∆ n = 6). (F) Cu content of purified intact mitochondria from mir1Δ cells assayed by Inductively coupled plasma - optical emission spectrometry (ICP-OES) and compared with that of parental WT cells. Both strains were grown in YP medium with glucose as a carbon source containing 10 μM bathocuproinedisulfonic acid (BCS) or 100 μM Cu (+Cu) (n = 3). (G) Fluorescence anisotropy (FA) of CuL (Ex320, Em400) upon the addition of reconstituted PIC2 or MIR1 in proteoliposomes prepared from extracted egg yolk lipids. Control FA of equal quantity of lipids without protein added was subtracted from each data point. Protein concentrations were determined by Bradford assay, and curves are fit with a nonlinear regression that assumes a single binding site. In all panels, data are plotted as the mean ± standard deviation and a one-way ANOVA was used for statistical analysis; ns: not statistically significant; *p<0.05, **p<0.01, ***p<0.001, ****p<0.0001.
