. 2021 Feb 16;10:e64690. doi: 10.7554/eLife.64690

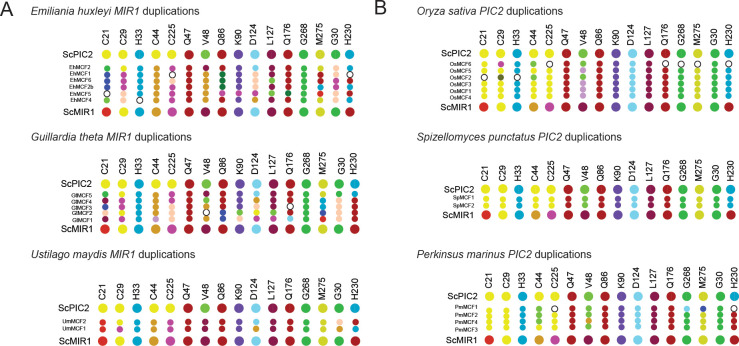
Figure 5. Conservation of selected residues in the PIC2/MIR1 family of transporters.

The tree topology is identical to that shown in Figure 2. Amino acids are colored according to the key, and insertion/deletion events that lead to gaps within the alignment are indicated by the hollow circles. P indicates position of S. cerevisiae PIC2, and M indicates S. cerevisiae MIR1. Small dots indicate that the residue is identical to that of PIC2 (shown at the top), and large dots indicate differences.

Figure 5.

Figure 5—figure supplement 1. Map of the residues found in gene duplications.

Figure 5—figure supplement 1.

(A) Graphical representation of the residues in organisms that have duplicated MIR1 and lack PIC2. (B) Graphical representation of the residues in organisms that have duplicated PIC2 and lack MIR1. Larger dots are residues in S. cerevisiae PIC2 or MIR1 while smaller dots are the residues encoded by the gene duplicates.
Figure 5—figure supplement 2. Position of residues mutated in the aqueous binding pocket of PIC2.
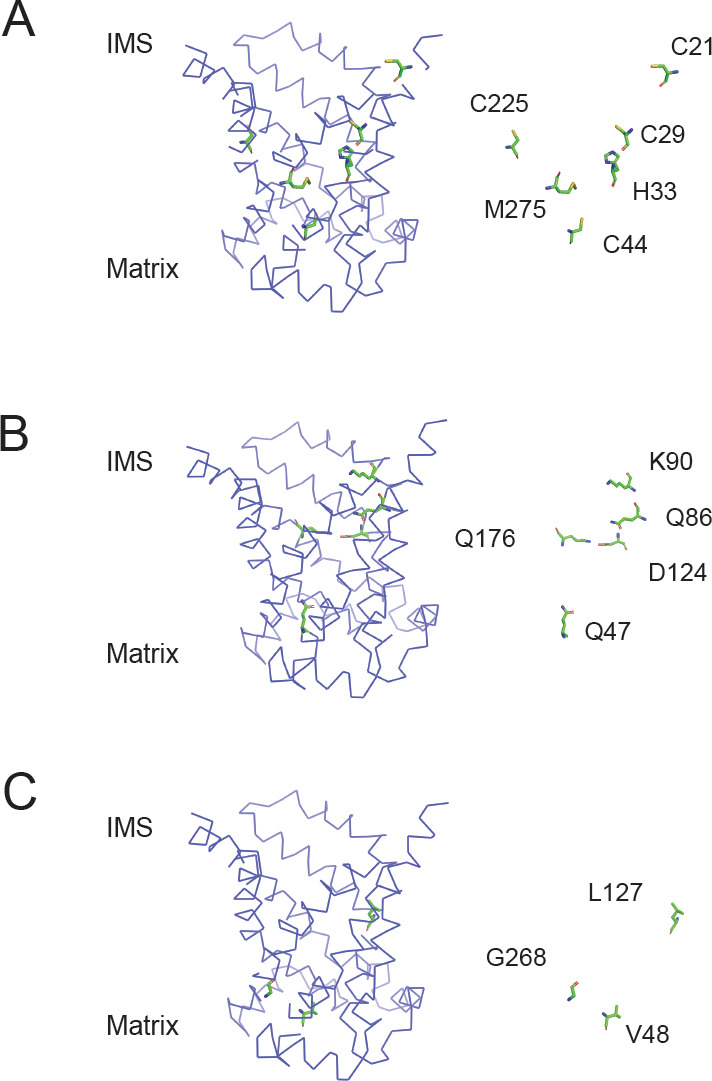
Figure 5—figure supplement 2.

(A) Model of the c-state of PIC2 with C21, C29, C44, C225, H33, and M275 highlighted in sticks format and with the backbone cartoon representation removed. (B) Model of the c-state of PIC2 with Q47, Q86, K90, D124, and Q176 highlighted in sticks format and with the backbone cartoon representation removed. (C) Model of the c-state of PIC2 with V48, L127, and G268 residues highlighted in sticks format and with the backbone cartoon representation removed.