. 2021 Feb 16;10:e64690. doi: 10.7554/eLife.64690

Figure 6. Expression of PIC2 and variants in L. lactis.

(A) Immunoblot of L. lactis extracts expressing empty vector (EV), wild-type PIC2 (WT), or a given PIC2 variant in which each of the listed residues was converted to an alanine prepared from equal numbers of cells based on optical density after induction with nisin. (B) Growth of L. lactis expressing EV, wild-type PIC2 (WT), or a given PIC2 variant in Ag+-containing media. Each bar represents the median of 10–18 independent cultures with 95% confidence interval as error bars (*p<0.05, **p<0.01, ***p<0.001, ****p<0.0001 based on one-way ANOVA relative to PIC2 wild-type control). The color of the bar indicates one of four major groupings: Cu-binding (orange), structural motifs or contact points (gray), evolutionarily conserved and present in the aqueous binding pocket of the transporter (green), and unstable in L. lactis (yellow). (C) As described in (B) except L. lactis strains were grown in AsO43−-containing media.
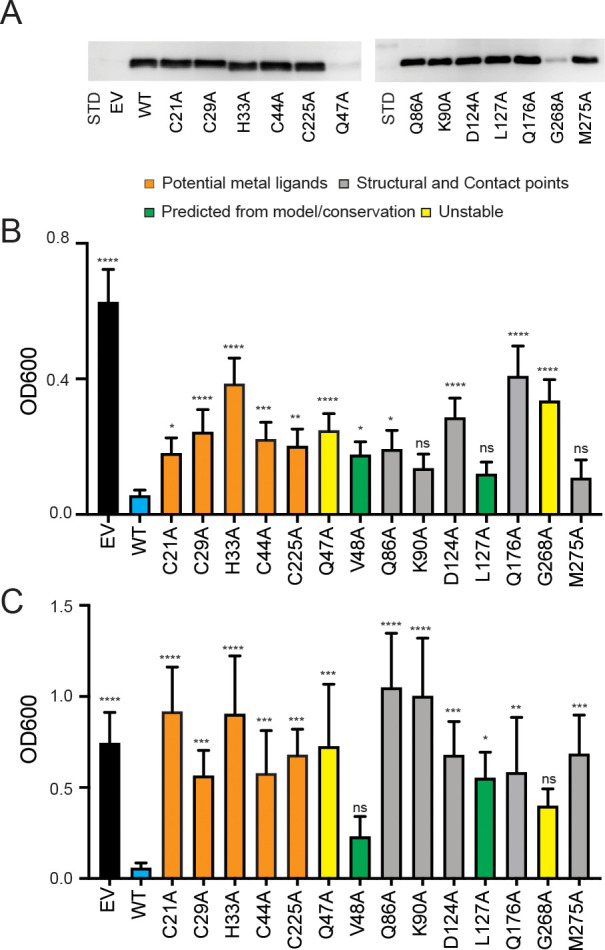
Figure 6.

Figure 6—figure supplement 1. Protein expression in L. lactis.
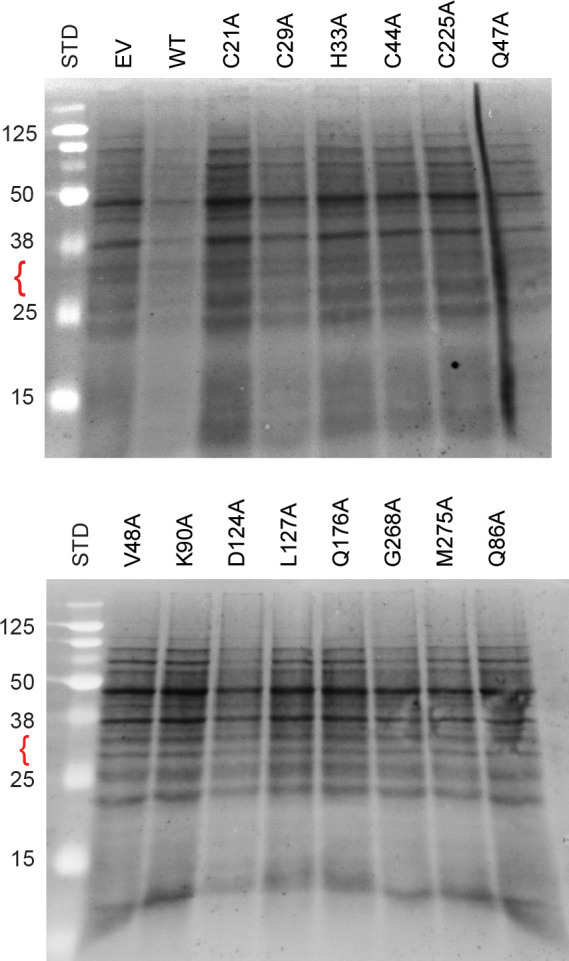
Figure 6—figure supplement 1.

Extracts of L. lactis expressing empty vector (EV), wild-type PIC2 (WT), or a given PIC2 alanine point mutation were prepared from equal numbers of cells based on optical density after induction with nisin. The total protein extracts were run on 10–15% tris-tricine SDS-PAGE gels and transferred to nitrocellulose membranes for staining with Sypro-Ruby and visualized under UV irradiation. The red bracket shows the expected size for PIC2. No obvious band is detected in any lane compared to EV, suggesting that the expression is only detectable by immunoblot analysis. Note that these membranes are independent gels not shown in Figure 6 or Figure 6—figure supplement 2. The size of each standard in kDa is shown (the unmarked standards are 260, 90, and 70 kDa).
Figure 6—figure supplement 2. Immunoblot analysis of PIC2 expressed in L. lactis.

Figure 6—figure supplement 2.

(A) Extracts of L. lactis expressing empty vector (EV), wild-type PIC2 (WT), or a given PIC2 alanine point mutant were prepared from equal numbers of cells based on optical density after induction with nisin. The total protein extracts were run on SDS-PAGE gels and transferred to nitrocellulose membranes probed with a polyclonal PIC2 antibody. Black and blue dashed boxes represent region cropped to become part of Figure 6A. (B) Independent gels of L. lactis extracts expressing EV, wild-type PIC2 (WT), or variant forms of PIC2. The size of each standard in kDa is shown (the unmarked standards are 125, 70, and 15 kDa).
Figure 6—figure supplement 3. Substitution of PIC2 residues for MIR1 residues.
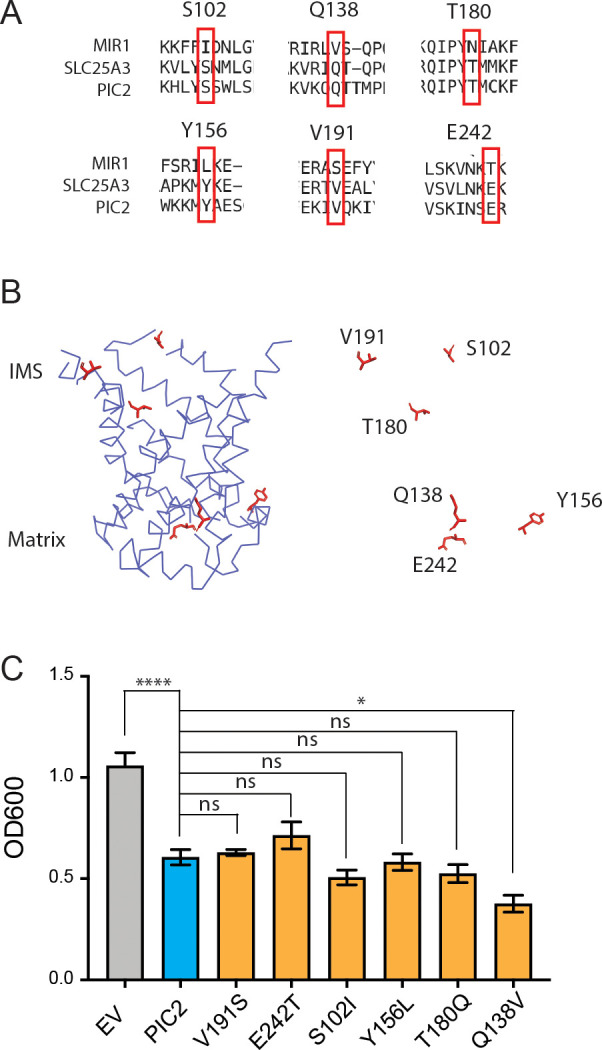
Figure 6—figure supplement 3.

(A) Alignment of amino acid sequences from MIR1, PIC2, and SLC25A3. (B) Model of the c-state of PIC2 with residues mutated highlighted in sticks format and with the backbone cartoon representation removed. (C) Growth of L. lactis expressing empty vector (EV), wild-type PIC2 (WT), or a given PIC2 variant in which each of the listed residues was converted to an alanine in Ag+-containing media. Each bar represents the median of six independent cultures with 95% confidence interval as error bars (*p<0.05, **p<0.01, ***p<0.001, ****p<0.0001 based on one-way ANOVA relative to PIC2 wild-type control).