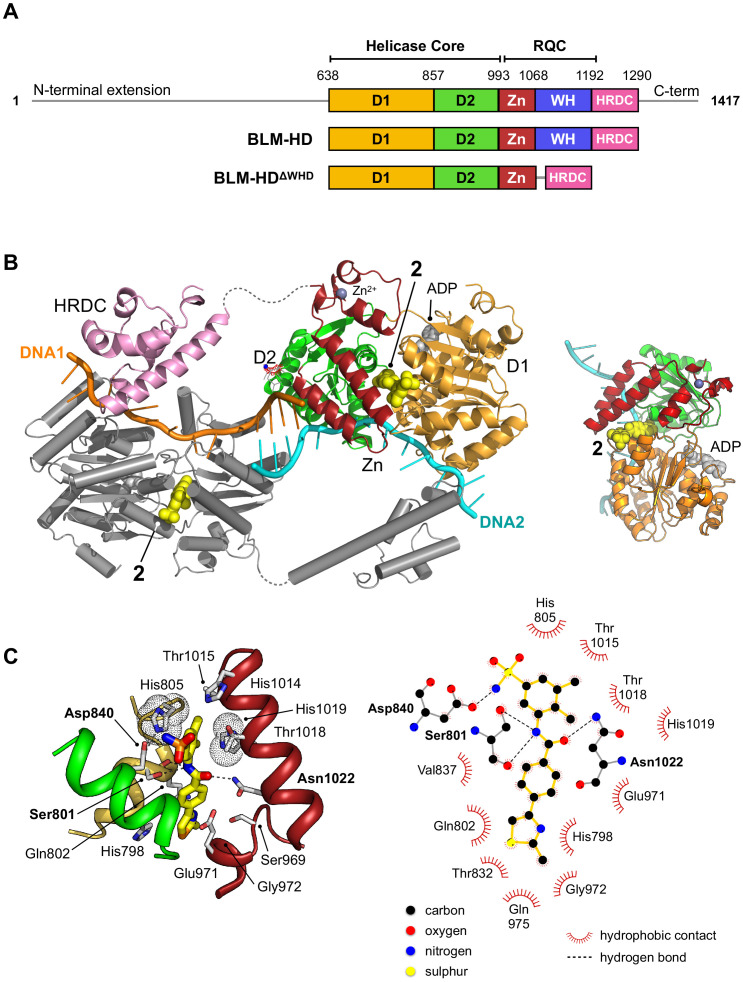
Figure 3. Structural overview of BLM-HDΔWHD in complex with compound 2.
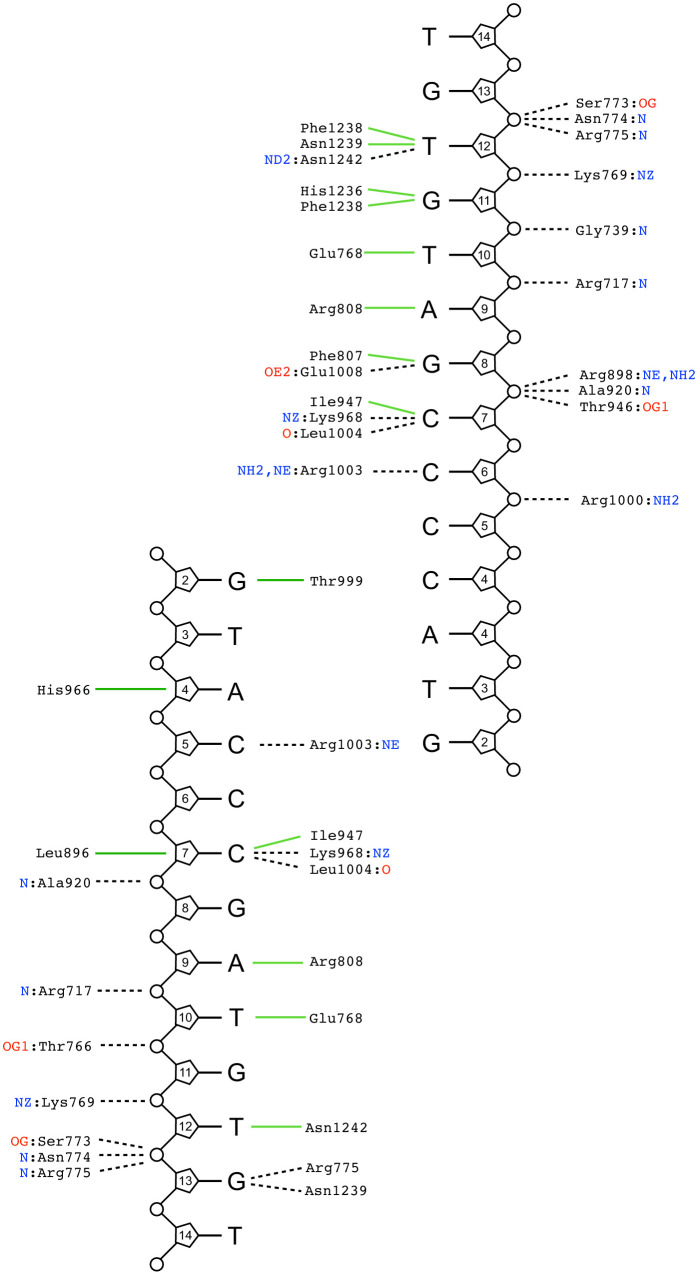
(A) Schematic representation of the domain composition and respective amino acid boundaries for full-length human BLM and the two expression constructs used in this study BLM-HD and BLM-HDΔWHD. D1 and D2 = domains 1 and 2 of the helicase core; Zn = zinc-binding domain; WH = winged-helix; HRDC = Helicase and RNaseD C-terminal domain; RQC = RecQ C-terminal domain. (B and B inset) Molecular secondary structure cartoon highlighting components of a ‘pseudo-symmetrical’ dimer found in the asymmetric unit of BLM-HDΔWHD/Mg-ADP/2/ssDNA crystals, driven by partial complementarity of the single-stranded 15mer oligonucleotide at its 5’ end (DNA1 and DNA2, coloured orange and cyan respectively). Compound 2 (yellow-coloured spheres) binds to a small pocket found on the opposite side to that which binds nucleotide (grey-coloured spheres). (C, left) Molecular cartoon representation highlighting interactions made between 2 and BLM-HDΔWHD. Key amino acid residues are labelled and shown in stick representation, with carbon atoms coloured according to the schematic shown in panel A. Compound 2 is shown in stick representation, with carbon atoms coloured yellow. Potential hydrogen bonds are indicated by black dotted lines. (C, right) Modified LIGPLOT+ (Laskowski and Swindells, 2011) diagram of protein-compound interactions. See associated key for additional detail.
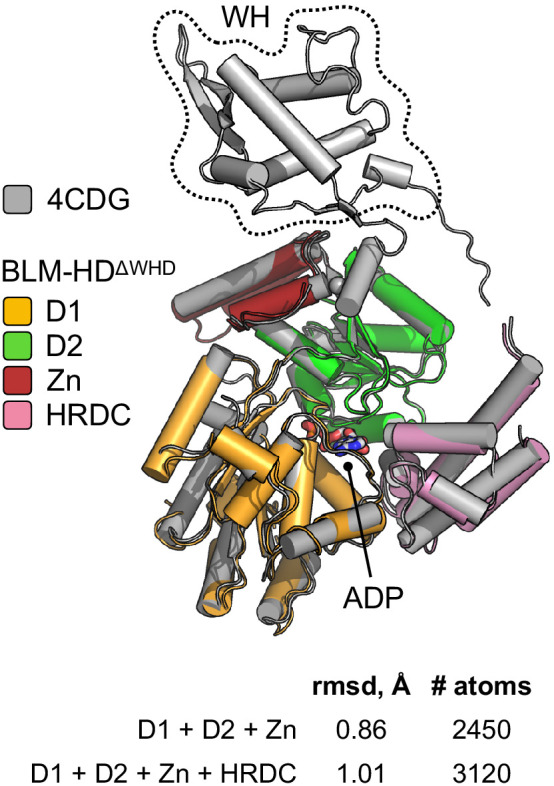
Figure 3—figure supplement 1. Superposition of the structures of BLM-HD (PDB: 4CDG) and BLM-HDΔWHD using PyMOL (Schrödinger, 2020).

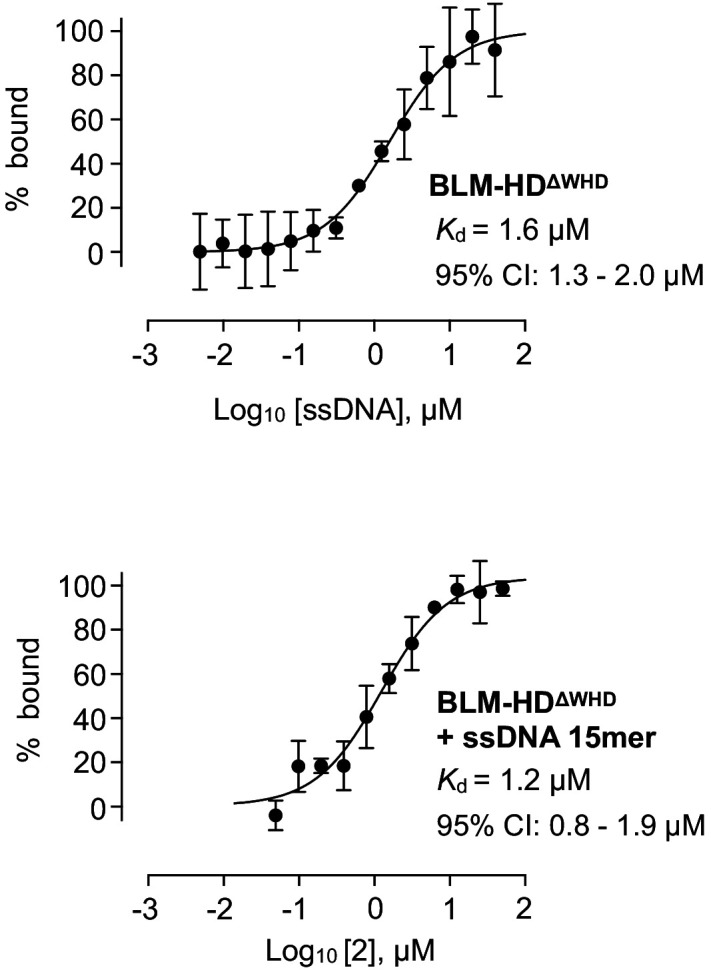
Figure 3—figure supplement 2. Isotherms for binding of BLM-HDΔWHD to (top) ssDNA-15mer and (bottom) compound 2 in the presence of ssDNA-15mer, as determined by MST.


