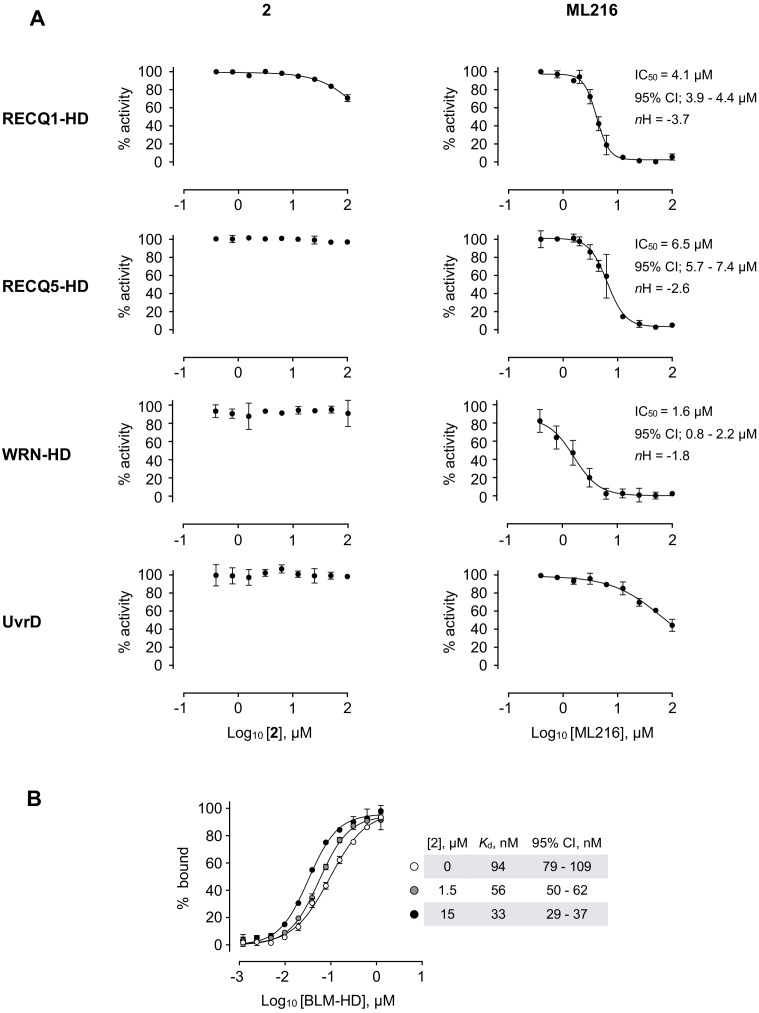
Figure 6. Selectivity profile of compound 2.
(A) Dose response curves from ATP-turnover assays for titration of compounds 2 and ML216 against purified recombinant BLM-HD, WRN-HD, RecQ1-HD, RecQ5-HD and UvrD respectively. Calculated values for IC50, nH and 95% CI are given in each case. (B) MST-derived binding isotherms for the interaction of BLM-HD with ssDNA-20mer in the presence of increasing concentrations of 2. Calculated values for Kd and 95% CI are given in each case. For all plots, data represent the mean of three technical replicates with error bars representing 1 SD.
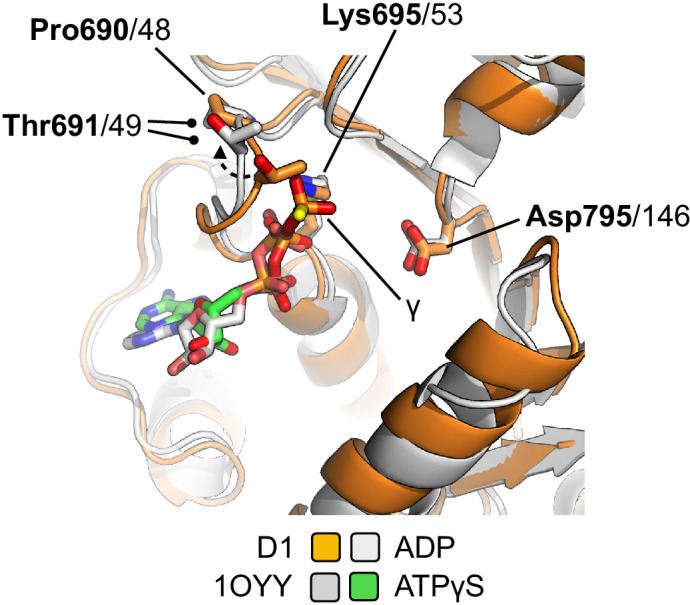
Figure 6—figure supplement 1. The active site of the liganded complex is compatible with binding of ATP, as judged by superposition of PDB entry 1OYY (E. coli RecQ in complex with ATP-γS Bernstein et al., 2003).


