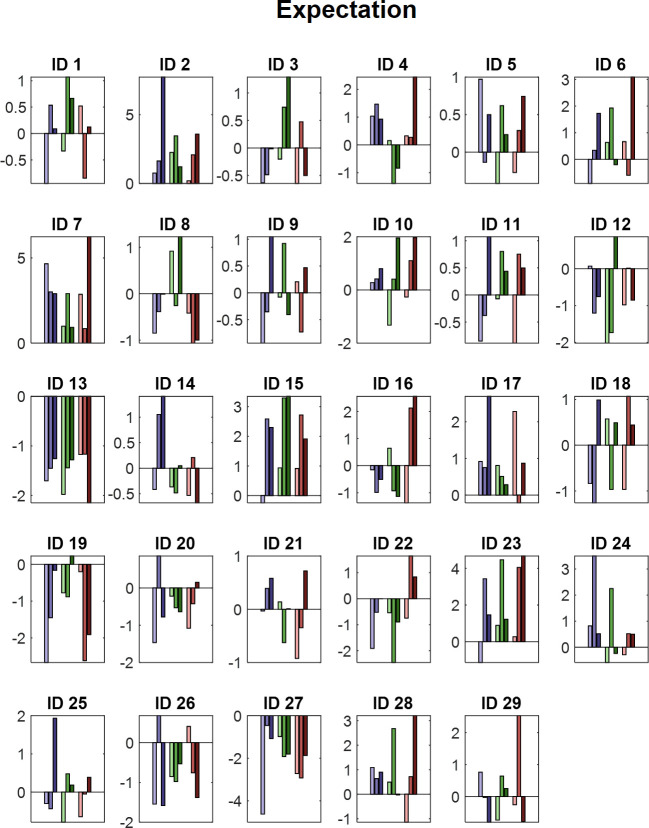
Figure 6. The main effect of expectation.
(a) Time–frequency representation of the statistical F-values averaged over all channels. The significant cluster is highlighted. The black box between 1500 and 1900 ms marks the jittered onset of the trigger signal to start the ramp-up of the heat stimulus. (b) Topography of the averaged power over time and frequency of the whole cluster extent (i.e. over the whole time and frequency range) at each channel. Brighter colors indicate higher F-values. (c) Power values for all conditions with a valid modality cue (expect heat receive heat) averaged over all significant time–frequency–electrode samples of the EXP cluster show alpha-to-beta enhancement (i.e. positive representation) associated with expectation. Error bars represent SEM. (d) Predicted responses based on the positive expectation factor are shown. The y-axis represents an imaginary response variable (e.g. EEG power). Each dot represents a different condition (in the order of the bar plot representation of average EEG power) for each stimulus–cue combination. Blue colors represent low heat conditions, green colors represent medium heat conditions, and red colors represent high heat conditions. Color intensities depict expectation level.


