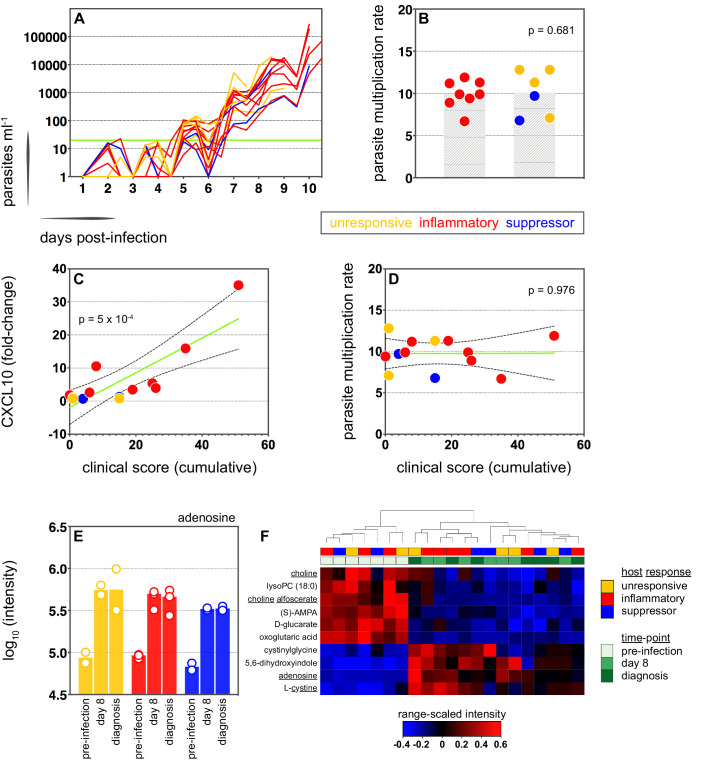
Figure 3. Systemic inflammation coincides with the onset of clinical symptoms.
(A) Parasite growth curves colour-coded by host response; each line represents one volunteer. Blood samples were collected every 12 hr for qPCR analysis of circulating parasite density and the horizontal green line represents the lower limit of quantification (20 parasites ml−1). (B) Parasite multiplication rates colour-coded by host response; each dot represents one volunteer and shaded areas show the mean value. A Mann Whitney test was used to ask whether the parasite multiplication rate observed in the inflammatory group was different to all other volunteers (p value is shown). (C and D) Linear regression of CXCL10 (C) or parasite multiplication rate (D) plotted against clinical score (the sum of adverse events during infection). CXCL10 fold-change measures plasma concentration at diagnosis over baseline (day −1). One dot represents one volunteer (no data for v020) and dots are colour-coded by host response. The green line represents the best-fit model (p value of the slope is shown) and dashed lines are the 95% confidence intervals. (E) Log10 transformed intensity values of adenosine in plasma during infection. An authentic standard was run in tandem with all samples to validate adenosine detection. (F) Range-scaled intensity values of 10 plasma metabolites that were differentially abundant during infection. Metabolites (rows) and samples (columns) are ordered by hierarchical clustering. Note that an authentic standard was used to validate detection of all underlined metabolites and the full name for oxoglutaric acid is 4-hydroxy-2-oxoglutaric acid. (E and F) Only plasma samples from the most inflammatory and symptomatic volunteers (v016, v017, and v013), the suppressor volunteers (v022 and v019) and two unresponsive volunteers (v018 and v208) were analysed for metabolite abundance.
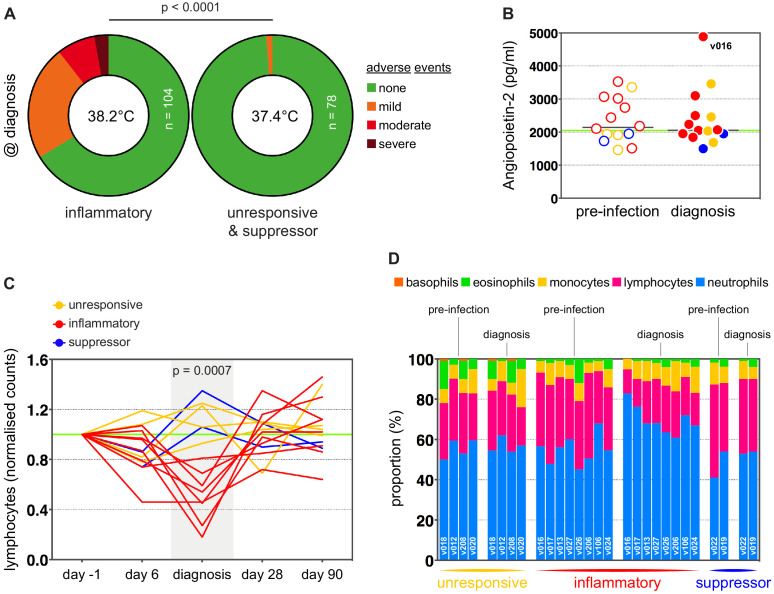
Figure 3—figure supplement 1. Adverse events after blood challenge.
Figure 3—figure supplement 2. Inflammation is linked to hallmark symptoms of malaria.
Figure 3—figure supplement 3. A conserved early metabolic signature of falciparum malaria.


