. 2021 Mar 2;10:e62800. doi: 10.7554/eLife.62800

Figure 4. Parasite variants associated with severe disease do not rapidly expand in naive hosts.

(A and B) Rlog expression values of var (A) and rifin (B) genes in the inoculum and diagnosis parasite samples after blood challenge (blue study); parasites obtained from volunteers infected by mosquito bite are also shown (pink study). Genes (rows) are ordered by hierarchical clustering and colour-coded by var type; parasite samples are colour-coded by host response; and in vitro cultured ring-stage parasites are shown for comparison. Two volunteers did not have parasite sequencing data (unresponsive volunteer v208 and suppressor volunteer v022) and the two inoculum samples are technical replicates of one biological sample. The var (PF3D7_1041300) and rifin (PF3D7_0401600) genes dominantly expressed across all samples are labelled. Var genes associated with severe disease (group A variant PF3D7_0400400 and DC8-like variants PF3D7_0600200 and PF3D7_0800300) are also labelled. Gene counts show the number of parasite genes that have at least three uniquely mapping reads; this provides a measure of genome coverage in every sample.

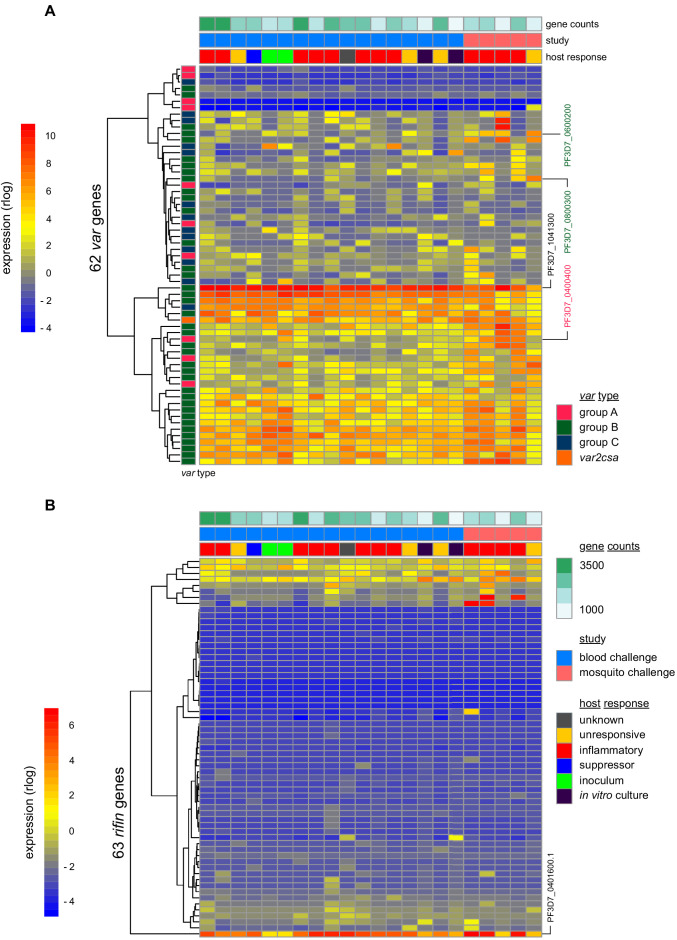
Figure 4—source data 1. Rlog expression values of var and rifin genes in parasites isolated from whole blood after controlled human malaria infection.

Figure 4.

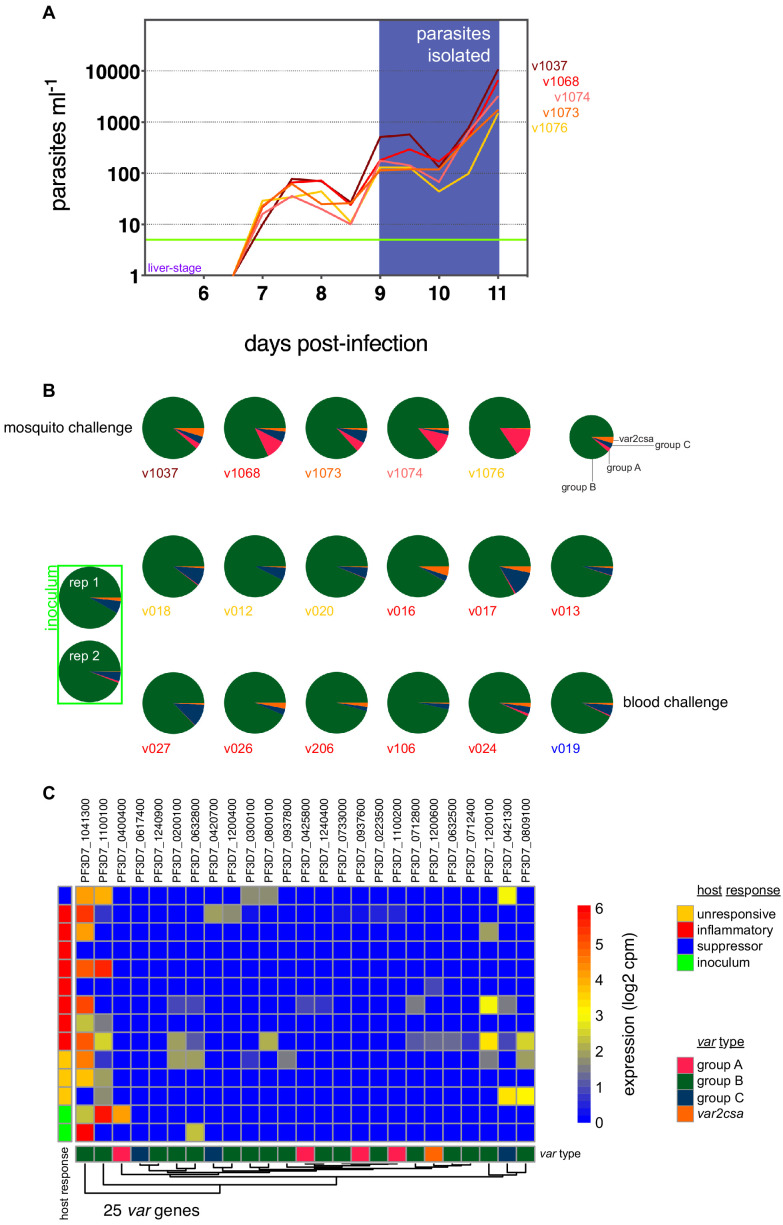
Figure 4—figure supplement 1. Group B var genes dominate the PfEMP1 landscape in naive hosts.

Figure 4—figure supplement 1.

(A) Parasite growth curves in five volunteers infected by mosquito bite; each line represents one volunteer and the horizontal green line represents the lower limit of detection (five parasites ml−1). On days 9, 10, and 11 post-infection parasites were isolated from whole blood and immediately processed for ex vivo RNA-sequencing – for every volunteer, read counts were pooled from all three time-points to generate a comprehensive parasite transcriptome 2–3 cycles after liver egress. (B) Proportion of read counts that map to groups A, B, C, or E (var2csa) var genes after mosquito challenge (top row) or blood challenge (bottom two rows); parasite samples are colour-coded by host response. Note that the two inoculum samples are a technical replicate of a single biological sample. (C) Log2(cpm) expression values of var gene intron-spanning reads in the inoculum and diagnosis samples after blood challenge. Genes (columns) are ordered by hierarchical clustering and colour-coded by var type; parasite samples by host response.