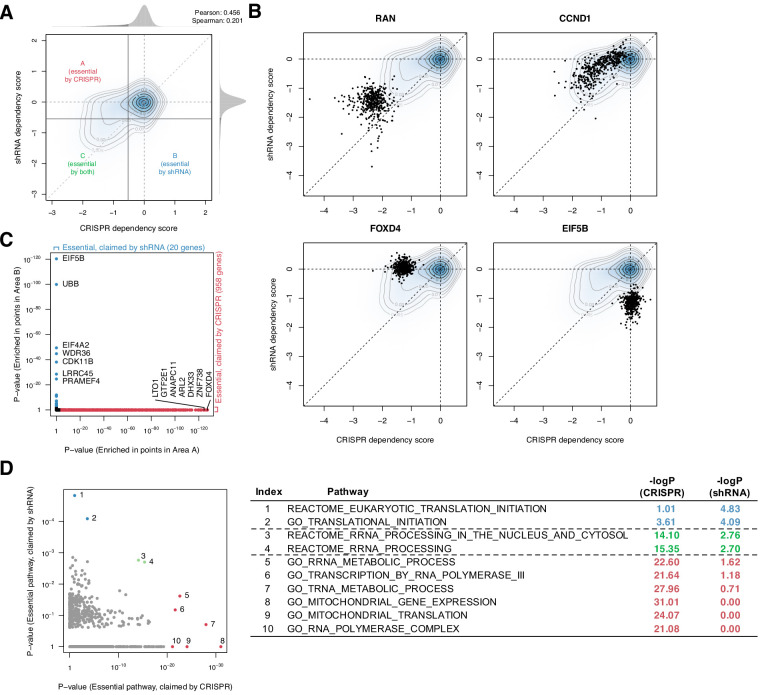
Figure 1. Systematic biases in CRISPR and shRNA dependency scores.
(A) Comparison of normalized CRISPR and shRNA dependency scores of 15,847 protein-encoding genes in 423 cell lines. The density and contour plot corresponds to the distribution of the scores from all gene perturbations. Vertical and horizontal solid lines indicate the essentiality thresholds for CRISPR and shRNA dependency scores, respectively. Areas A, B, and C correspond to the regions where only CRISPR, only shRNA, or both CRISPR and shRNA claimed essential. (B) Comparison of CRISPR and shRNA targeting four genes. In each panel, data points correspond to each gene’s perturbation in 423 cell lines. Each point corresponds to one cell line. (C) In total, 958 and 20 genes were claimed essential only by CRISPR or shRNA but not by the other method, respectively (Fisher’s exact test, p-value<1e-3). (D) Assessment of the pathways overrepresented by the essential genes claimed only by CRISPR or shRNA, highlighted in C (Fisher’s exact test).

