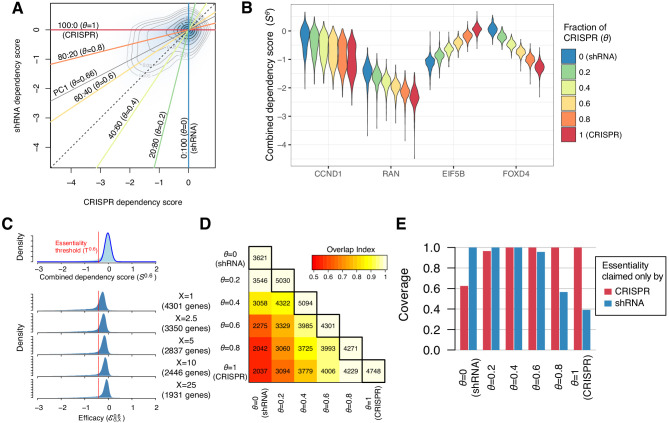
Figure 2. Identification of essential genes based on combined dependency score.
(A) Dependency scores defined with different mixing ratios are computed by projecting each point onto the corresponding lines. θ denotes the fraction of CRISPR dependency scores. PC1 is the direction of the primary principal component line. (B) The distributions of combined dependency scores for four genes shown in Figure 1B. (C) Top panel: the distribution of the combined dependency score . The essentiality threshold is determined based on this distribution. Bottom panel: the distribution of efficacy scores with various X (-th percentile). Genes that satisfy are defined as commonly or selectively essential, and the number of essential genes depends on X. (D) On the diagonal line, the numbers of commonly or selectively essential genes identified with various θ are shown. In the off-diagonal area, the numbers of essential genes identified with two distinct θ are shown. Color code indicates an overlap index, a measure of overlap between two essential gene sets. The overlap index ranges from 0 (no shared genes) to 1 (the smaller set is included in the larger set). (E) The extent to which the genes claimed essential by only CRISPR or shRNA are covered by the essential genes discovered by each mixing ratio.

