. 2021 Feb 8;10:e57116. doi: 10.7554/eLife.57116

Figure 5. Essential gene clustering.

(A) The framework of ensemble clustering with hierarchy over DBSCAN ot-SNE with Spearman distance matrix (ECHODOTS) algorithm. (B) Nine gene clusters and their associated pathways. (C) Median efficacy and selectivity of large clusters. (D) Genes consisting of large clusters with high selectivity highlighted in C. (E–G) The intra-cluster connectivity of three gene clusters as exemplars. The colors of nodes indicate their membership of small clusters, and the edges indicate that the two connected genes have Spearman correlation coefficient greater than 0.1. Numbers in E indicate Spearman correlation coefficients.

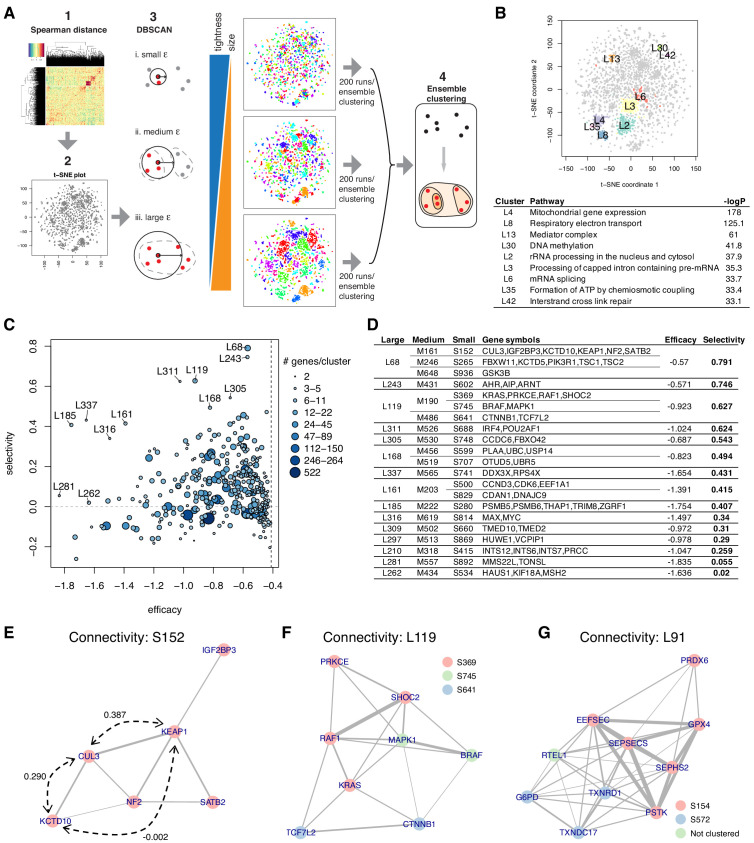
Figure 5—source data 1. Cluster membership of essential genes and probability of their assignment to clusters for six θ.
Figure 5—source data 2. Pathways overrepresented in large clusters for six θ.
Clusters that contain 15 genes or more are only considered in this analysis.

Figure 5.

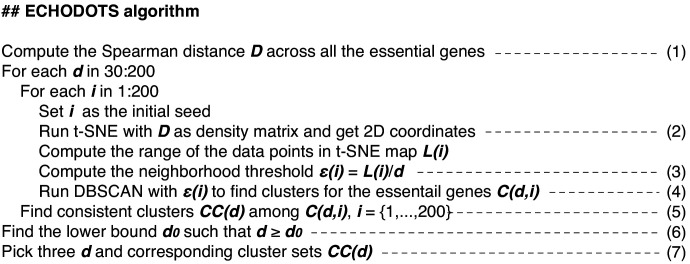
Figure 5—figure supplement 1. Ensemble clustering with hierarchy over DBSCAN ot-SNE with Spearman distance matrix (ECHODOTS) algorithm.

Figure 5—figure supplement 1.

The ECHODOTS algorithm is written using pseudocodes. The line numbers correspond to the line numbers in the main text.
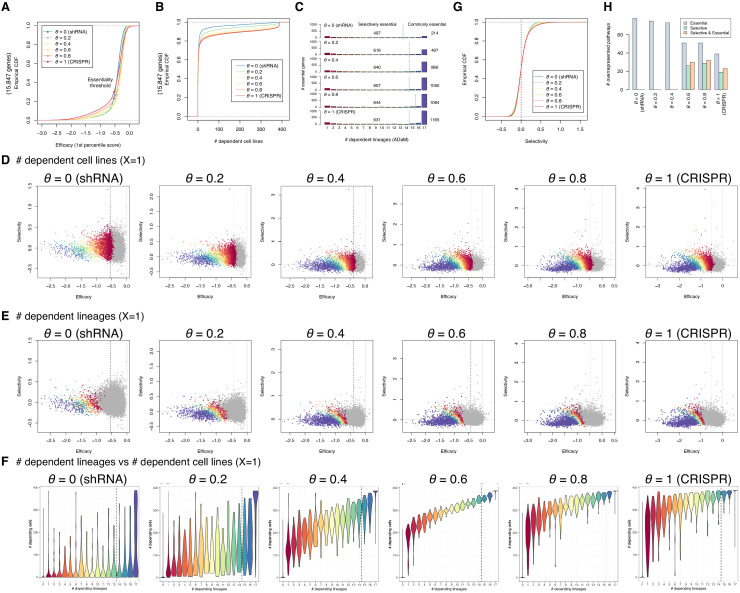
Figure 5—figure supplement 2. Efficacy, selectivity, and dependent lineages with various θ.

Figure 5—figure supplement 2.

(A) Empirical cumulative density functions (CDFs) of the efficacy G,Xθ across all the genes with various θ. (B) Empirical CDFs of the number of dependent cell lines across all the genes with various θ. (C) The distribution of the number of dependent lineages among essential genes with various θ. The genes in the left- and right-hand side of the vertical lines are considered selectively and commonly essential according to the Adaptive Daisy Model (ADaM). (D, E) The efficacy–selectivity plot of all the genes with various θ (X=1). The genes are color-coded based on the number of dependent cell lines (D) and lineages (E). (F) Relationship between the number of dependent lineages and the number of dependent cell lines with various θ (X=1). (G) Empirical CDFs of the selectivity 𝒮G,Xθ across all the genes with various θ. (H) The number of overrepresented pathways associated with genes with strongly negative efficacy and high selectivity, strongly negative efficacy, and high selectivity.
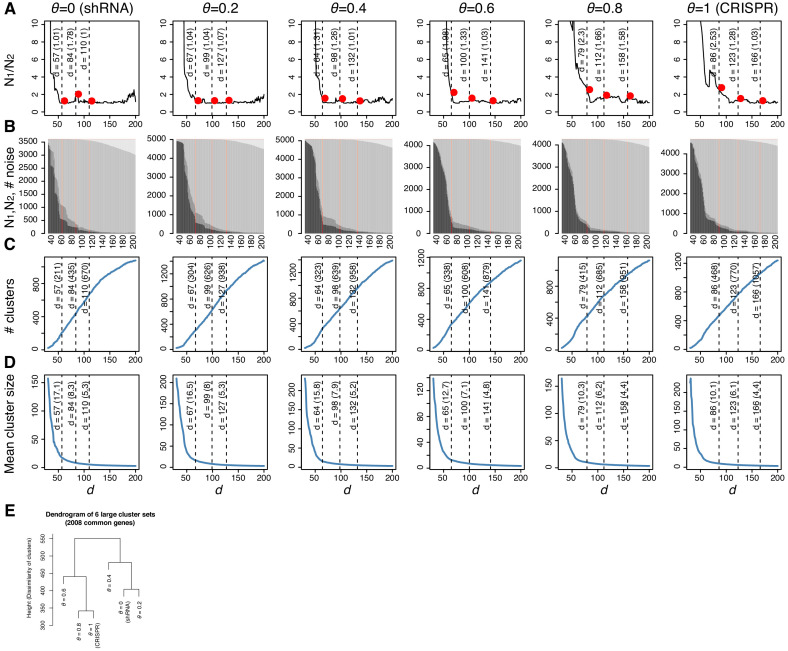
Figure 5—figure supplement 3. Dependent cell lines and lineages using six dependency scores.

Figure 5—figure supplement 3.

In A–D, four parameters were plotted on Y-axis against d=L/ε on X-axis, where ε is a neighborhood threshold in density-based spatial clustering and noise (DBSCAN), for various θ. (A) The ratio between the sizes of the first and second largest clusters (N1/N2). (B) The number of genes assigned into the first and second largest clusters (N1 and N2) and the number of noise genes (Nn), that is, the genes that are not clustered with other genes. (C) The number of clusters. (D) The mean cluster size. (E) The similarity of the clusters with various θ. Cluster membership of the 2008 genes that were found essential with all θ was compared using cl_dissimilarity in clue R package.