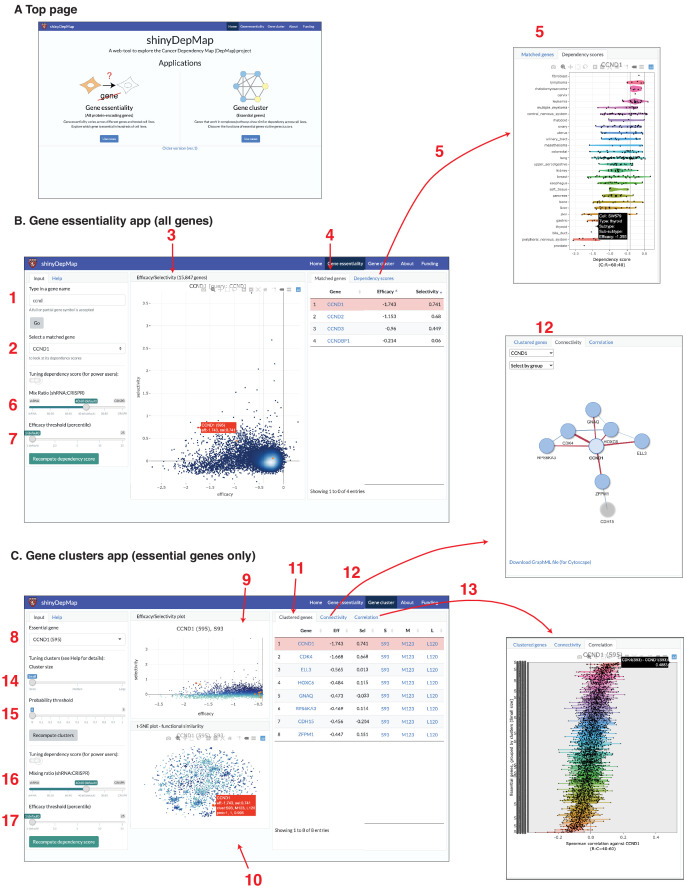
Figure 6. shinyDepMap: a web tool to explore DepMap dataset.
(A) Top page. (B) Gene essentiality app. 1: textbox to type in a (partial) gene symbol to query; 2: dropdown menu to select a gene symbol that matches the query; 3: efficacy–selectivity scatterplot; 4: list of matched genes; 5: combined dependency score profile of the gene selected in 2; 6: mix ratio; 7: efficacy threshold (C) Gene clusters app; 8: dropdown menu to select an essential gene to explore; 9: efficacy–selectivity plot for essential genes; 10: t-distributed stochastic neighbor embedding (t-SNE) plot; 11: list of clustered genes; 12: connectivity plot; 13: Spearman correlation between the selected gene and other essential genes; 14: cluster size input; 15: probability threshold input; 16: mix ratio; 17: efficacy threshold.

