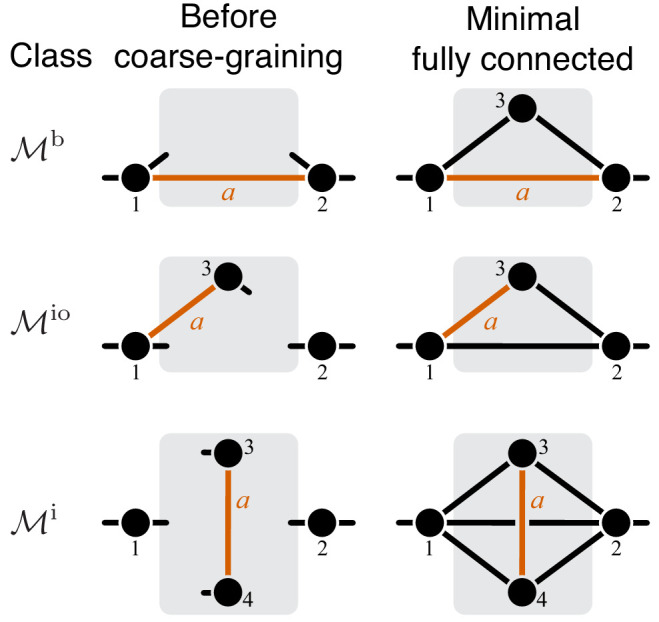
Figure 7. Classification of single-marked modules.

Left column shows a general module from each topological class. The right column shows a minimal fully connected module in each topological class (see text for details). Circles represent metabolites and lines represent reactions. Only the I/O metabolites and the metabolites that participate in the marked reaction are shown, all other metabolites are suppressed. Short lines that have only one terminal metabolite represent all remaining reactions in which this metabolite participates, reactions between all other metabolites are suppressed. Metabolites are labeled according to the conventions listed in the text. The marked reaction is colored orange and labeled . The module is represented by a gray rectangle, and the rest of the network is not shown.
