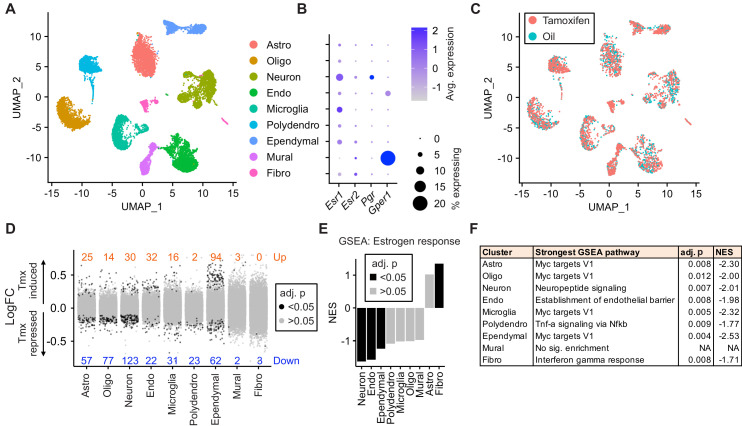
Figure 3. Tamoxifen treatment induces gene expression changes in various cell types of the hypothalamus and preoptic area (hypothalamus-POA).
(A) UMAP showing clustering of the major cell types of the hypothalamus-POA based on single-cell transcriptomics. Each colored dot is a cell, with different colors representing different cell types listed to the right. (B) Dot plot showing expression of estrogen and progesterone receptors in cell types identified in (A). (C) UMAP comparing cells derived from mice receiving tamoxifen (pink) or oil injections (cyan). (D) Collapsed volcano plots showing differential gene expression, represented as log base 2 of fold change (LogFC), induced by daily tamoxifen treatment in various cell types identified. Up/down numbers refer to total number of significantly (Bonferroni adj. p<0.05) up- and downregulated genes. (E) Gene set enrichment analysis (GSEA) to find tamoxifen-induced signatures of estrogen response in hypothalamus-POA cell types. (F) Most strongly enriched or depleted pathways in GSEA comparing control to tamoxifen-treated cells. All analyses were done from cells harvested from female mice injected daily with oil (n = 3) or tamoxifen (n = 5) over 28 days. (E–F) NES: Normalized enrichment score, adj. p: Benjamini-Hochberg adjusted p-value.


