. 2021 Mar 1;10:e63333. doi: 10.7554/eLife.63333

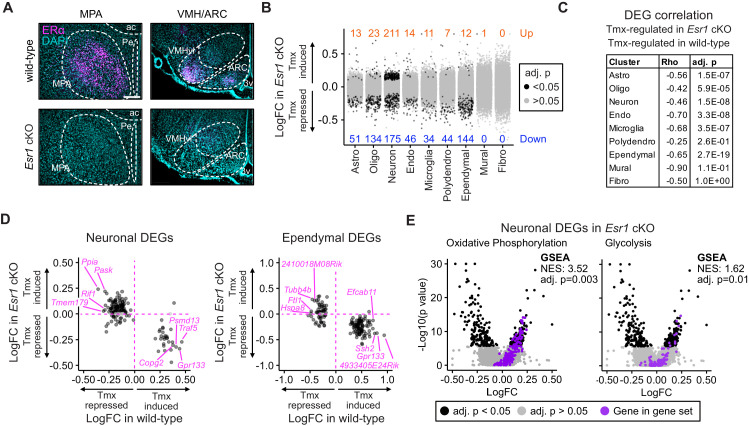
Figure 5. Esr1 conditional knockout reverses hypothalamus and preoptic area (hypothalamus-POA) responses to tamoxifen.

(A) Immunoreactive staining of estrogen receptor alpha (ERα) in the medial preoptic area (MPA), ventromedial nucleus of the hypothalamus (VMH), and the arcuate nucleus of the hypothalamus (ARC) of ERα knockout and wild-type female mice. Scale bar: 200 um. (B) Differentially expressed genes (DEGs) induced by daily tamoxifen treatment in cell types of the Esr1f/f;Nkx2-1Cre (Esr1 cKO) hypothalamus-POA. Up/down numbers refer to total number of significantly (Bonferroni adj. p<0.05) up- and downregulated genes. (C) Table of correlations showing how tamoxifen-induced gene expression changes in wild-type cells correlate with tamoxifen-induced gene expression changes in Esr1 cKO cells. Rho: Spearman correlation coefficient, adj. p: Benjamini-Hochberg adjusted p-value. (D) Gene-by-gene comparison of how tamoxifen treatment affects expression in wild-type and Esr1 cKO neurons and ependymal cells. Named genes are a subset of genes discordantly regulated by tamoxifen in wild-type and Esr1 cKO cells. A complete list of genes shown here is in Supplementary file 1i. (E) Volcano plots of all tamoxifen-induced or repressed DEGs (black) overlayed with gene sets (purple) involved in oxidative phosphorylation or glycolysis. NES: Normalized enrichment score, gene set enrichment analysis (GSEA) adj. p: Benjamini-Hochberg adjusted p-value, DEG adj. p: Bonferroni adjusted p-value. (B–E) Data from n = 4 oil treated Esr1 cKO and n = 4 tamoxifen-treated Esr1 cKO, n = 3 oil treated wild-type and n = 5 tamoxifen-treated wild-type mice.

Figure 5.

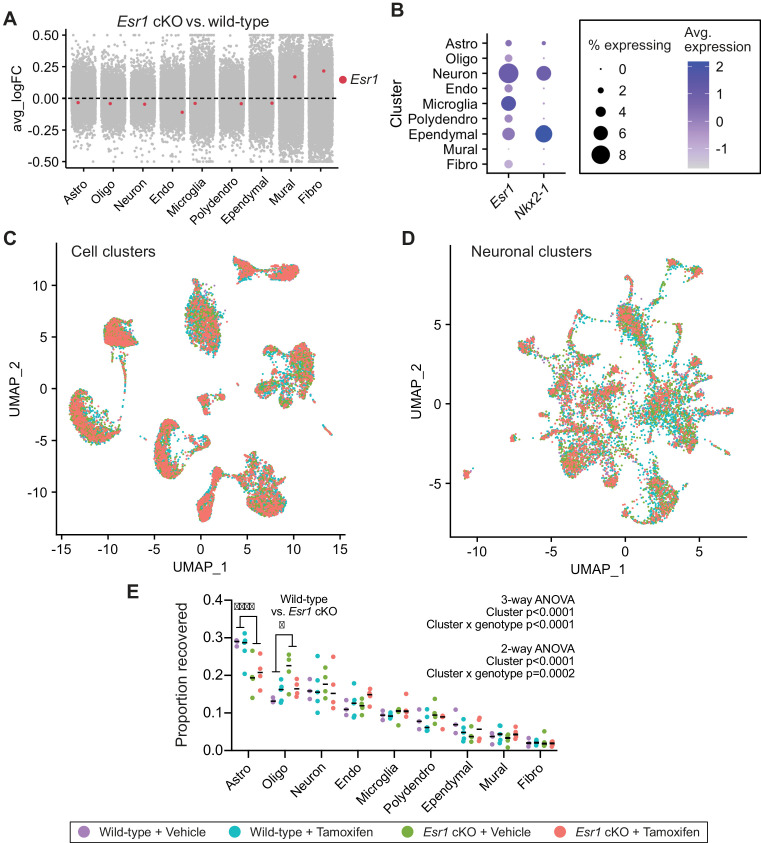
Figure 5—figure supplement 1. Cell cluster analyses across all four treatment groups.

Figure 5—figure supplement 1.

(A) Collapsed volcano plot showing the average fold change (avg_logFC) in Esr1 transcript expression in Esr1 cKO vs. wild-type mice. (B) Dotplot showing expression of Esr1 and Nkx2-1 in cell types of the hypothalamus and preoptic area (hypothalamus-POA). (C) UMAP of all hypothalamus-POA derived cell types showing individual cells (dots) from the four treatment groups. (D) UMAP of hypothalamus-POA derived neuronal types showing individual neurons (dots) from the four treatment groups. (E) Proportion of each cell type recovered across the four treatment groups. Three-way ANOVA (main effects: cluster x genotype x treatment) shows an effect of cluster (F8,108=91.33, p<0.0001) and the cluster x genotype interaction (F8,108=4.775, p<0.0001). Two-way ANOVA (cluster x genotype collapsed across treatments) shows an effect of cluster (F8,112=86.87, p<0.0001) and the cluster x genotype interaction (F8,112=4.218, p=0.0002). Sidak’s multiple comparisons tests reveal effects of genotype on the proportion of astrocytes (t126 = 5.138) and oligodendrocytes (t126 = 2.896). All other main effects, interactions, and multiple comparisons p>0.05.
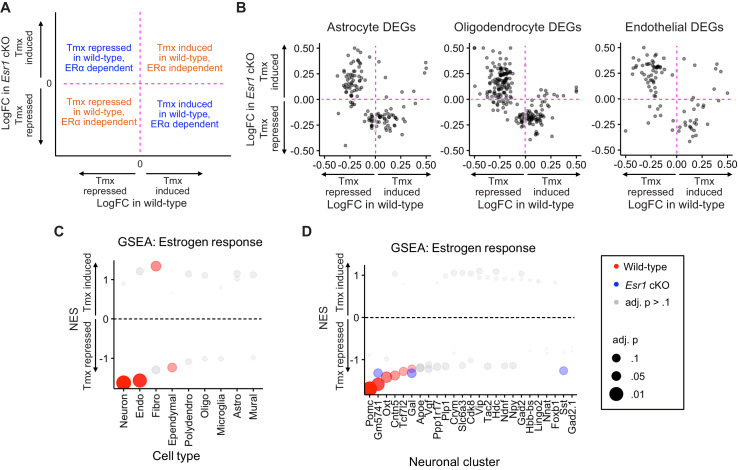
Figure 5—figure supplement 2. Comparison of gene expression changes induced by tamoxifen in wild-type and Esr1 cKO mice.

Figure 5—figure supplement 2.

(A) Key to comparison of genes induced by tamoxifen in wild-type compared to how they are regulated by tamoxifen in Esr1 cKO animals. (B) Gene-by-gene comparisons of how tamoxifen treatment affects expression in wild-type and Esr1 cKO cells. Each dot is a gene. Only genes significantly up- or downregulated by tamoxifen in wild-type mice are shown. (C) Gene set enrichment analysis (GSEA) NES showing tamoxifen regulation of estrogen responsive genes in wild-type and Esr1 cKO hypothalamus and preoptic area (hypothalamus-POA) cell types. (D) GSEA NES showing tamoxifen regulation of estrogen responsive genes in wild-type and Esr1 cKO neuronal subtypes. NES: Normalized enrichment score, adj. p: Benjamini-Hochberg adjusted p-value.