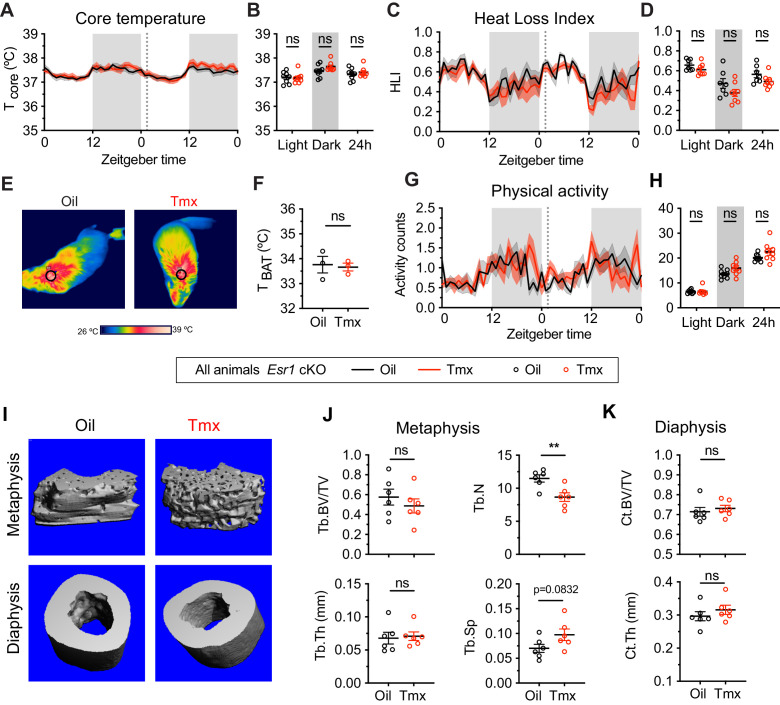
Figure 6. The homeostatic effects of tamoxifen are dependent on estrogen receptor alpha (ERα) in the hypothalamus and preoptic area (hypothalamus-POA).
(A) Hourly average of core body temperature in Esr1 cKO female mice over 2 days before and 3 weeks after injections (dotted line). (B) Average core body temperature from mice shown in panel (A) highlighting per animal averages in light (7:00 to 19:00), dark (19:00 to 7:00), and total 24 hr periods (n = 8, treatment: F1,14=1.395, p=0.7144). (C) Heat loss index (HLI) calculated from continuous measurements of core and tail temperature. (D) Average HLI from mice shown in panel (C) (n = 7–8, treatment: F1,13=3.109, p=0.1013). (E) Thermographic images of interscapular skin above brown adipose tissues (BAT) depots in Esr1 cKO female mice injected with either oil or tamoxifen. (F) Quantification of temperature of skin above intrascapular BAT depots (n = 3, t4 = 0.264, p=0.8048). (G) Hourly average of movement over 2 days before and after injections (dotted line). (H) Average movement from mice shown in panel (H) (n = 8, treatment: F1,14=2.638, p=0.1266). (I) Representative micro-computed tomography (microCT) images showing bone density of the distal metaphysis and midshaft diaphysis of femurs from tamoxifen or oil treated Esr1 cKO female mice. (J) Trabecular bone volume fraction (BV/TV, t10 = 0.8340, p=0.4237), trabecular numbers (Tb.N, t10 = 3.349, p=0.0074), trabecular thickness (Tb.Th, t10 = 0.2668, p=0.7951), and trabecular separation (Tb.Sp, t10 = 1.924, p=0.0832) in distal metaphysis of femurs (n = 6). (K) Bone volume fraction (Ct.BV/TV, t10 = 0.5963, p=0.5643) and cortical thickness (Ct.Th, t10 = 0.9720, p=0.354) in diaphysis of femurs (n = 6). Line shading and error bars represent standard error of the mean (SEM). ns, non-significant; **, p<0.01 for Sidak's multiple comparisons test (B, D, and H) or two-tailed t-test (F, J, and K).

