. 2021 Feb 5;10:e60577. doi: 10.7554/eLife.60577

Figure 2. Rad52 diffusion at the single molecule level in the presence of a single I-SceI induced DSB.

(A) Design of the experiment. We induced a single DSB in haploid cells harboring Rad52 endogenously fused to Halo as well as an I-SceI cut site inducible under galactose promoter. The DSB is induced for 2 hours and fluorgenic JF646 dyes are added to the medium during the last hour of incubation prior visualization by SPT.for 2 hr and fluorogenic JF646 dyes are added to the medium during the last hour of incubation prior visualization by SPT. Individual Rad52-Halo/JF646 are tracked at 20 ms time intervals (50 Hz), during 1000 frames. Only cells harboring a Rad52 focus are analyzed. (B) Typical S/G2-phase haploid cells harboring Rad52-Halo/JF646. From left to right: transmission image; time-projection of a typical SPT acquisition; Rad52 detections: each spot represents a single detection of Rad52-Halo/JF646, the color map indicates the number of Rad52 neighbors inside a 50 nm radius disk; Rad52 traces: each line represents the trajectory of a detection, the color map indicates the distance in μm covered in 20 ms. The bar scale represents 1 μm. This particular nucleus exhibits 682 detections and 129 traces. (C) Distribution of tracks length of Rad52-Halo/JF646 in the presence and the absence of a single DSB. The histogram combines 27 S/G2 phase cells, all of them harboring a Rad52 focus, representing 1061 traces (mean length of 8 fames), and 8495 displacements of 20 ms time-intervals. (D) Probability Density Function (PDF) of Rad52-Halo/JF646 molecules in haploid S/G2-phase cells in the presence of a single DSB. The time interval is 20 ms. Green: Rad52 data (27 cells, 1061 trajectories); Black: 1-population fit; Red: 2-population fit; Yellow: 3-population fit. (E) Cumulative Density Function (CDF) of Rad52-Halo/JF646 molecules in haploid S/G2-phase cells in the presence of single DSB. Dashed green line: data; Black: 1-population fit; Red: 2-population fit; Yellow: 3-poulations fit. The p-values are indicated in parenthesis (see Materials and methods). (F) Left: density map of a typical nucleus following the induction of a single DSB. The nucleus is divided in two zones based on a density threshold: the Rad52 focus (highlighted in red) and the rest of the nucleus (highlighted in blue). Right: displacements histograms of trajectories contained inside foci (red) versus outside foci (green). If a trajectory crosses the focus boundary, it is cut into two parts: the part inside and the part outside of the focus. The blue histogram represents the displacement of Rad52 molecules in the absence of DSB (shown in Figure 1E). (G) Mean Square Displacement (MSD) curve of Rad52/Halo/JF646 molecules inside foci. The dotted line shows a fit of the MSD with a confined model (see Materials and methods). (H) Effect of SUMOylation: we induced a single DSB in haploid cells expressing Rad52 endogenously fused to SUMO and Halo, as well as an I-SceI cut site at LYS2 locus inducible under galactose promoter. The DSB is induced for 2 hr and fluorogenic JF646 dyes are added to the medium during the last hour of incubation prior to visualization by SPT. Individual Rad52-Halo/JF646 are tracked at 20 ms time intervals (50 Hz), during 1000 frames. (I) Displacement histogram of traces inside foci of Rad52 wild type cells versus cells expressing Rad52-SUMO in S/G2 phase cells. A single I-SceI DSB is induced for 2 hr, and only cells harboring a Rad52 focus are analyzed. Red: Rad52 wild type; Blue: Rad52-SUMO. (J) MSD curves of individual Rad52 molecules inside foci (red, same data as Figure 3E) versus individual Rad52-SUMO molecules inside foci (pink). MSD curves are fitted with a confined model (see Materials and methods).

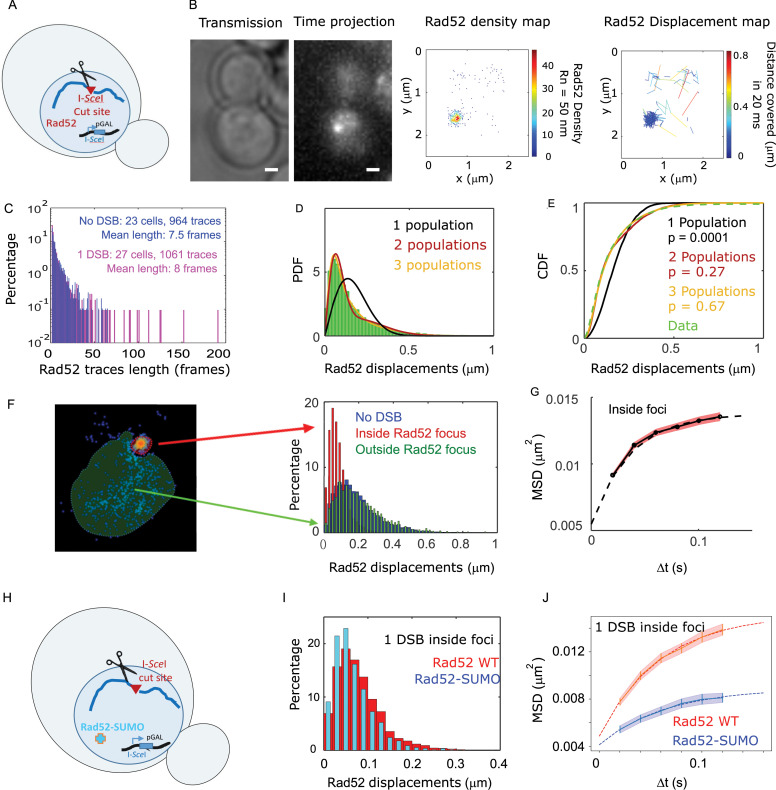
Figure 2.

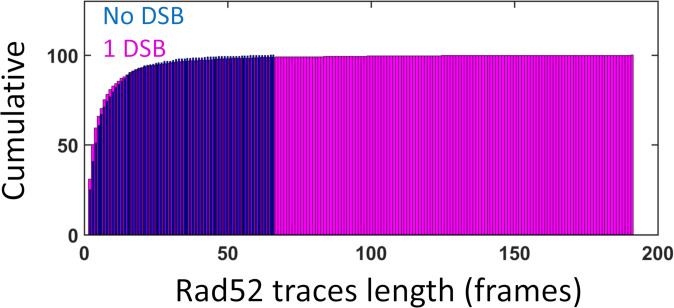
Figure 2—figure supplement 1. Cumulative distribution of Rad52-Halo/JF646 traces length in the nucleus.

Figure 2—figure supplement 1.

(similar data as Figure 2C). Blue: in the absence of DNA damage; Pink: in the presence of a single DSB.
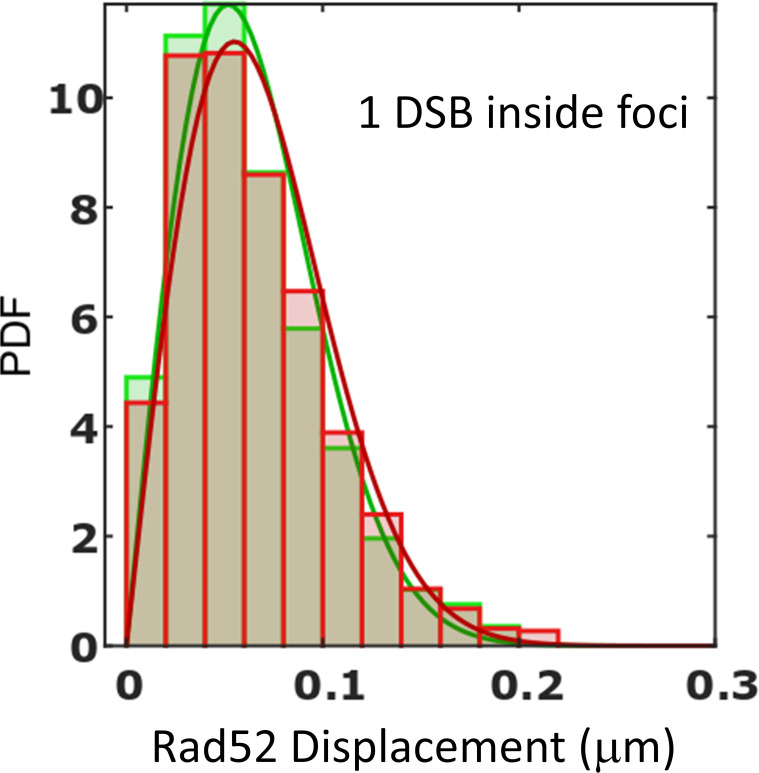
Figure 2—figure supplement 2. Criteria to determine traces inside repair foci.

Figure 2—figure supplement 2.

We used two methods to select traces inside foci.The first method uses a density threshold of Rad52 detections; since foci are much denser than the rest of the nucleus, it allows us to simply separate traces inside and outside foci (as illustrated in Figure 2F). The second method consists of selecting traces longer than 70 time-points since no trace longer than 70 were found in the absence of DSB. The Probability Density Function (PDF) for traces inside foci is shown for each method. Green: selection of traces based on a density threshold; Red: selection of traces based on their length (see Materials and methods). For both method, plain lines represent a 1-population of the data (p=0.99, t2-sided KS test for both methods). In both cases, we found that data are well represented by a 1-population fit.
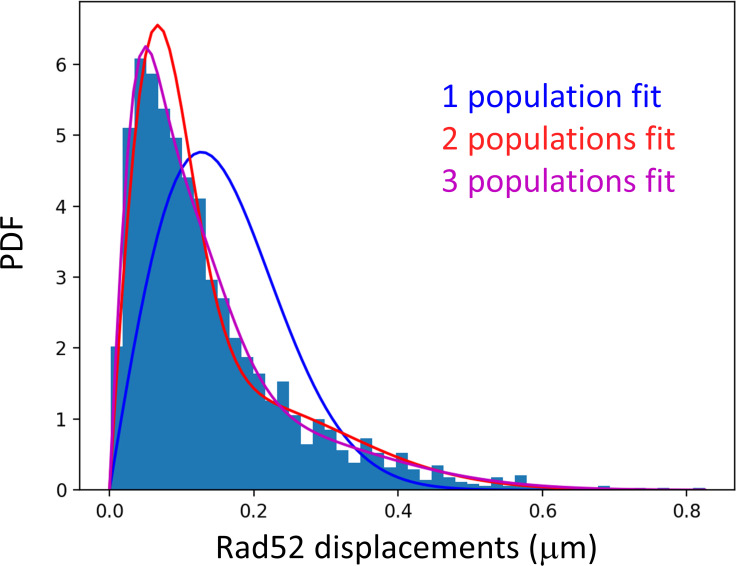
Figure 2—figure supplement 3. PDF of Rad52-SUMO after 2 hr of DSB induction Rad52-SUMO is tracked at 20 ms time intervals in cells following 2 hr of DSB induction.

Figure 2—figure supplement 3.

The Probability Density Function is calculated using all the Rad52-SUMO traces inside nuclei harboring a Rad52 focus. Similar to wild type Rad52, following 2 hr of DSB induction, Rad52-SUMO exhibits three diffusive behaviors (p<10−7, p<10−7 and p=0.96, two-sided Kolmogorov-Smirnoff (KS) test for the 1-, 2- and 3-populations fits respectively, see Materials and methods). For the 3-populations fit, we obtained the best fitted values of D1 = 0.036 ± 0.009, D2 = 0.18 ± 0.03 and finally D3 = 1.07 ± 0.08 μm2/s. We recovered similar diffusion coefficient in cells expressing the Rad52-SUMO than in the wild type cells (see Supplementary file 1 also).
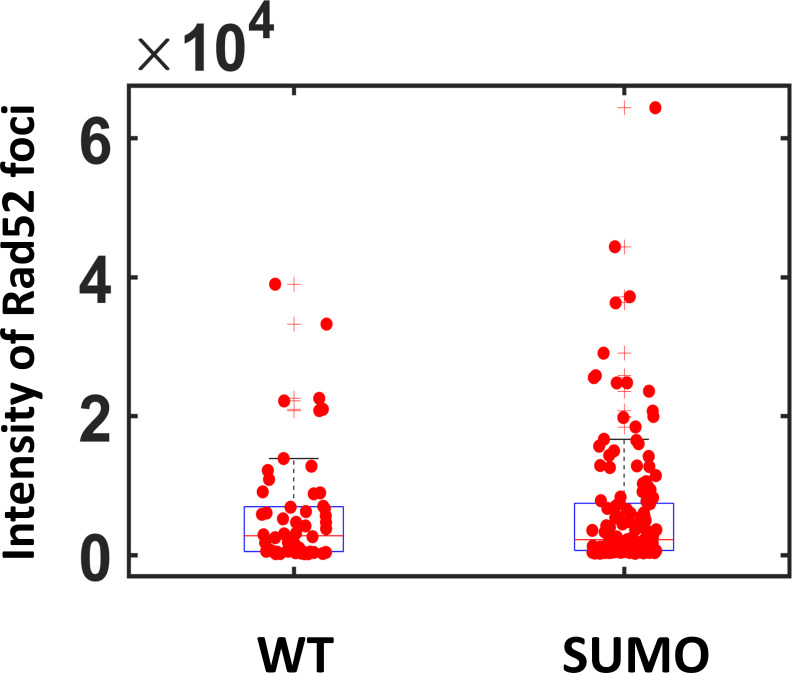
Figure 2—figure supplement 4. Intensity of Rad52 versus Rad52-Sumo foci To compare the intensity of Rad52 and SUMOylated Rad52 foci, we observed cells expressing Rad52-Halo of Rad52-SUMO-Halo using wide field microscopy.

Figure 2—figure supplement 4.

A single I-SceI DSB was induced for 2 hr; during the last hour of induction, cells were incubated with JF646 dyes at 50 nM, a concentration 10 times higher than the one used for single molecule tracking. Such concentration allows the observation of the entire Rad52 focus as a single spot. Foci intensity is quantified using a home-made software Q-Foci (Guidi et al., 2015). We found that the intensity of wild type and SUMOylated Rad52 foci is not significantly different (p=0.6, Wilcoxon-Mann-Whitney test).
Figure 2—figure supplement 5. Mobility of individual Rad52 molecules in haploid versus diploid yeast To investigate Rad52 mobility in a situation where the DSB can be repaired, we compared the mobility of individual Rad52 molecules in haploid versus diploid cells.

Figure 2—figure supplement 5.

(A) Design of the experiment in diploid cells: we induced a single DSB in diploid cells harboring Rad52 endogenously fused to Halo (both Rad52 alleles are fused to Halo) as well as an I-SceI cut site at one of the 2 LYS2 locus inducible under galactose promoter. The DSB is induced for 2 hr and fluorogenic JF646 dyes are added to the medium during the last hour of incubation prior visualization by SPT. Individual Rad52-Halo/JF646 are tracked at 20 ms time intervals (50 Hz), during 1000 frames. Only S/G2 cells harboring a Rad52 focus are analyzed. (B) Probability Density Function (PDF) of Rad52-Halo/JF646 molecules in diploid S/G2-phase cells in the presence of a single DSB. The time interval is 20 ms. Green: Rad52 data (15 cells, 1082 trajectories); Black: 1-population fit; Red: 2-population fit; Yellow: 3-population fit. (C) Probability Density Function in the nucleus of haploid versus diploid cells harboring a Rad52 focus after 2 hr of DSB induction. Blue: haploid cells; Red: diploid cells. The lines indicate a 3-populations fit of the experimental data (p=0.67 in haploids and p=0.34 in diploids, 2-sided KS test). Rad52 mobility in diploid cells is slightly lower than in haploid (p=0.96, t2-sided KS test, panel C). Difference of mobility between haploid and diploid cells has been also observed in the case of chromatin tracking at URA3 (Miné-Hattab et al., 2017), or could be due the fact that diploid and haploid cells are not at the same stage of HR. (D) Mean Square Displacement (MSD) curve of Rad52/Halo/JF646 molecules inside foci cells after 2 hr of DSB induction. Blue: haploid cells; Red: diploid cells. The dotted line shows a fit of the MSD with a confined model (see Materials and methods).