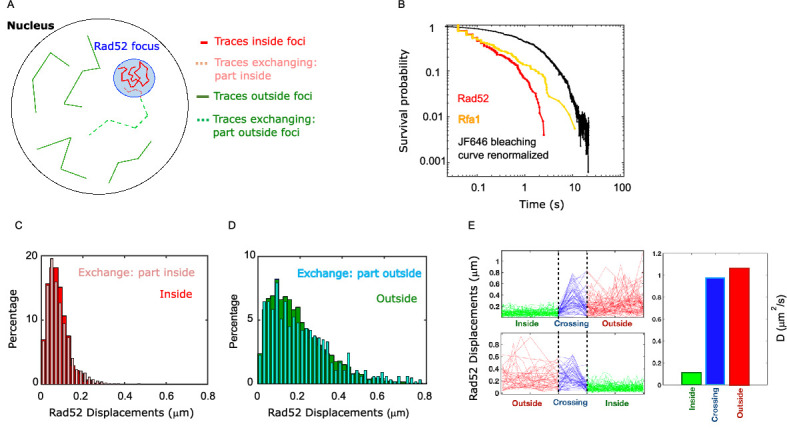
Figure 5. Rad52 diffusion coefficient changes when molecules enter and escape repair foci.
(A) Illustration of the three categories of Rad52 traces observed in response to a single DSB in the nucleus: (i) traces staying inside repair foci (plain red), (ii) traces crossing foci boundaries (dotted lines), with red-dotted lines for the part inside foci and blue-dotted lines for the part outside; (iii) traces staying outside of the foci (plain blue). (B) Survival probability curve of Rad52 molecules inside foci (red), Rfa1 (yellow) and renormalized bleaching curve of the JF646 (black) (see Figure 1—figure supplement 3). (C) Light red: displacement histogram of traces represented as dotted red lines in Figure 4A (travelers, part inside foci). Dark red: displacement histogram of traces represented in plain red in Figure 4A (traces inside foci). (D) Light blue: displacement histogram of traces represented as dotted blue lines in Figure 4A (travelers, part outside foci). Dark blue: displacement histogram of traces represented in plain blue in Figure 4A (traces outside foci). (E) Left: Step size for traces inside the focus (green), crossing (blue), and outside the focus (red). The x-axis is squeezed so that all traces take the same space, in order to visually compare the step sizes. Above: traces starting inside and ending outside. Below: traces starting outside and ending inside the focus. Right: Bar plot showing the estimated diffusion coefficient calculated from all the traces.


