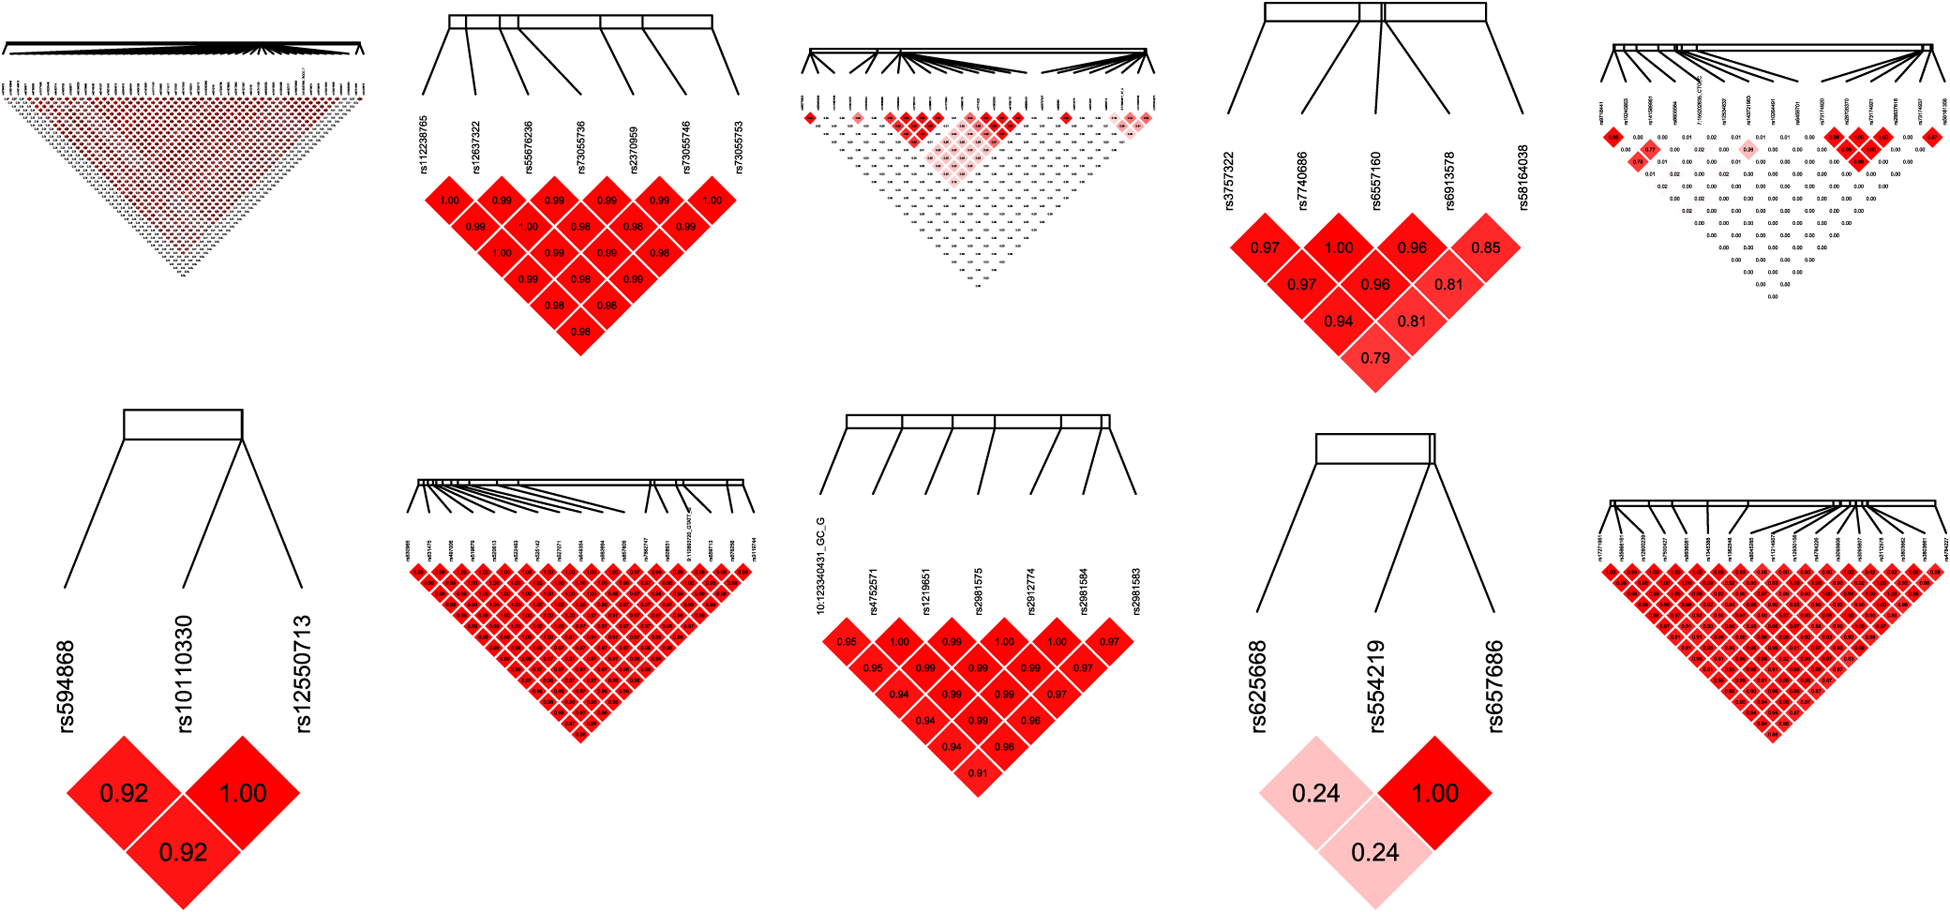
FIGURE 3.

The linkage disequilibrium heat map of SNPs in the verified supervariants. The top row from left to right are for SNPs selected on Chromosomes 2, 3, 5, 6, and 7, respectively. The bottom row from left to right are for SNPs selected on Chromosomes 8, 9, 10, 11, and 16, respectively. SNP, single-nucleotide polymorphism
