
Figure 5. Effects of pH and ligand binding on the nIR MCD Spectra of ferric H93K SWMb.
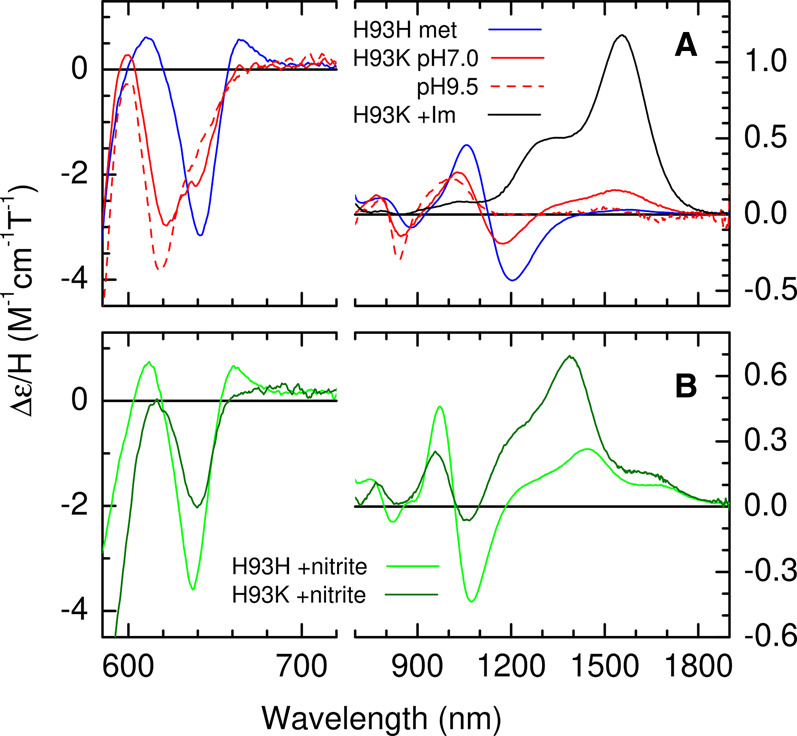
(A) nIR MCD spectrum (580–1900 nm) of ferric WT SWMb (790 µM; blue trace) and ferric H93K SWMb at pH 7.0 (470 µM; solid red trace) and pH 9.5 (180 µM; dashed red trace). The product of the reaction of ferric H93K SWMb (490 µM;) with 10 mM imidazole at pH 7.0 is indicated by the black trace. (B) nIR MCD spectrum (580–1900 nm) of ferric WT SWMb (640 µM; green trace) and ferric H93K SWMb (428 µM; dark green trace) after reaction with of 100 mM nitrite.