Figure 1.

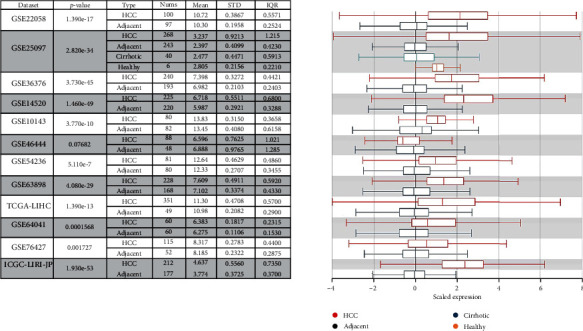
Chart and plot showing the expression of SSRP1 in tumor tissues and the adjacent normal tissues, according to t-test in HCCDB.

Chart and plot showing the expression of SSRP1 in tumor tissues and the adjacent normal tissues, according to t-test in HCCDB.