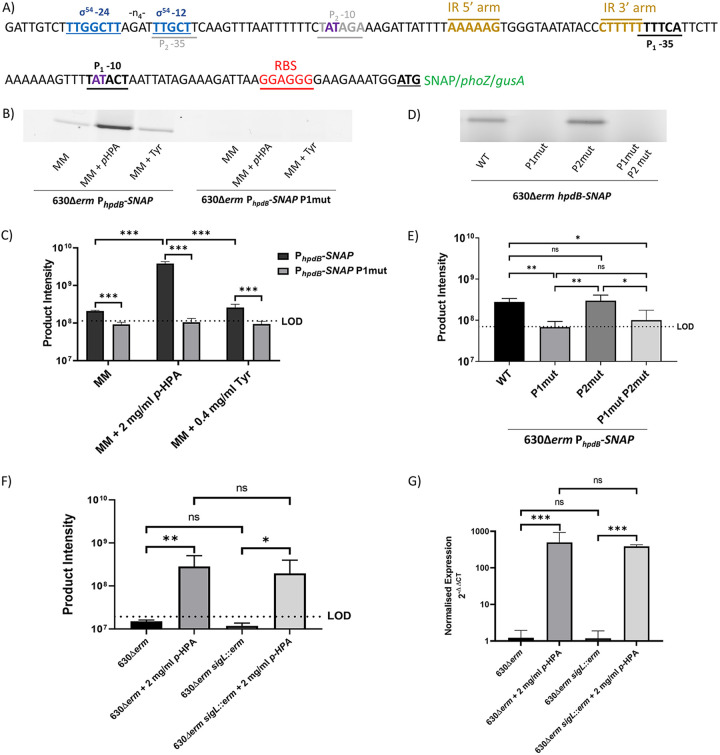
FIG 7.
Mutation of the potential promoter regions in the hpdBCA-SNAP-tag reporter constructs. (A) Modifications by site-directed mutagenesis of the P1 and P2 promoter regions within the hpdBCA-SNAP reporter construct. The following putative promoter elements are marked on the diagram: putative ribosome binding site (red), putative P1 promoter (black), putative P2 promoter −10 region site (gray), putative SigL promoter (blue), putative inverted repeats (gold), and bases mutated by site-directed mutagenesis for functional analysis are indicated in purple. (B) SDS-PAGE gel image of the 630Δerm PhpdB-SNAP alongside the mutated P1 promoter (630Δerm PhpdB-SNAP P1mut). (C) Quantification of expression from 630Δerm PhpdB-SNAP and 630Δerm PhpdB-SNAP P1mut. (D) SDS-PAGE expression from the 630Δerm phpdBCA-SNAP compared to the mutated P1 promoter 630Δerm PhpdB-SNAP P1mut, the mutated P2 promoter the 630Δerm PhpdB-SNAP P2mut, and the mutation of both P1 and P2 promoters in MM plus 2 mg/ml p-HPA. (E) Quantification of expression from 630Δerm phpdBCA-SNAP compared to the mutated P1 promoter 630Δerm PhpdB-SNAP P1mut, the mutated P2 promoter the 630Δerm PhpdB-SNAP P2mut, and the mutation of both P1 and P2 promoters in MM plus 2 mg/ml p-HPA. (F) Strains 630Δerm and 630Δerm sigL::erm were transformed with PhpdB-SNAP construct. Expression of the SNAP-tag construct was assessed in BHISG medium compared to BHISG supplemented with 2 mg/ml p-HPA. Samples were run on an SDS-PAGE gel and processed with the fluorescent substrate TMR-Star prior to quantification of the SNAP-tag band using ImageQuant TL software. Three biological replicates were quantified using the following formula: product intensity = pixel volume/OD590. The dotted lines in panels C, E, and F the represent the limit of detection (LOD) calculated as the average of the following formula for all samples: background pixel volume/culture OD590nm. (G) qRT-PCR was used to assess the expression of hpdC in late exponential phase normalized to the 16S rRNA internal control (2–ΔΔCT)). All data represent means and standard errors. Statistical analysis was undertaken using linear regression to determine (i) whether there is a significant effect of growth medium composition on expression from the PhpdB-SNAP in the 630Δerm strain compared to the mutated P1 promoter PhpdB-SNAP P1mut, (ii) whether there is an effect on expression of PhpdB-SNAP in which the P1 and P2 −10 boxes were mutated (TAT>TGC bases) in the P1 and P2 −10 sites, (iii) whether there is a significant increase in expression of the SNAP construct in media supplemented with p-HPA in both 630Δerm and 630Δerm sigL::erm strains, and (iv) whether there are any differences in the expression of hpdC in the 630Δerm strain compared to the 630Δerm sigL::erm strain (*, P < 0.05; **, P < 0.01; ***, P < 0.001.

