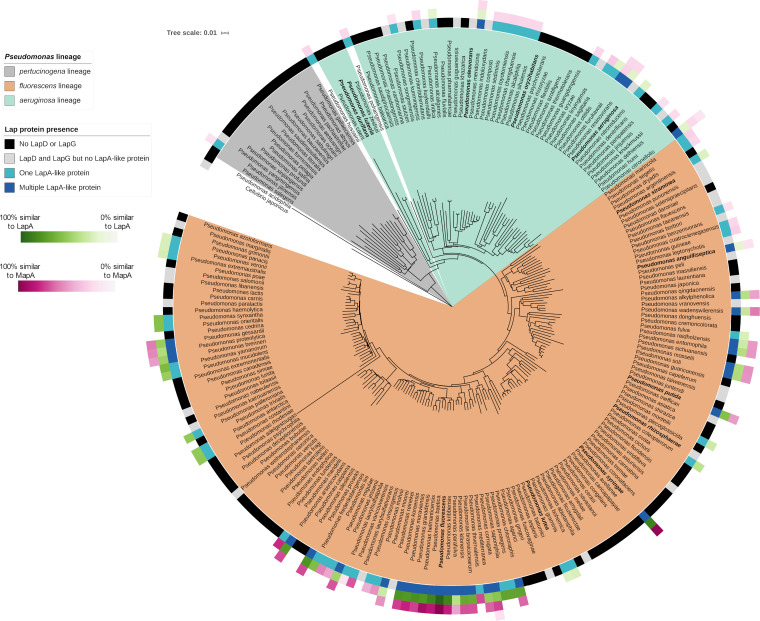
FIG 10.
Phylogenetic distribution of the Lap proteins among members of the Pseudomonas genus. Shown is a phylogenetic tree of Pseudomonas lineages. The innermost colored ring around the tree indicates whether LapD and LapG are encoded by the indicated species (as determined by finding the intersection of the species lists retrieved from the NCBI Conserved Domain Database for pfam06035 and pfam16448 domains) and how many LapA-like proteins were identified in that species using the analysis described in Materials and Methods. The outermost three rings indicate the percent similarity between the LapA-like proteins identified in each species and either LapA or MapA. Amino acid sequences of putative LapA-like proteins were aligned with LapA and MapA in pairwise alignments using MUSCLE (65) (https://github.com/GeiselBiofilm/Collins-MapA/tree/master/Supplemental_File_Alignments), and the percent sequence similarity was determined by counting the positions identified as similar by the MUSCLE program. The percent similarity of whichever was most similar (either LapA or MapA) is indicated, with darker color indicating higher similarity. The order of the three rings indicating similarity with LapA and MapA is organized by the relative size of the LapA-like proteins encoded by each organism. The innermost of the three rings is the largest LapA-like protein encoded by that organism. The second and third rings represent alignments of the second- and third-largest LapA-like proteins, respectively, identified in organisms that are predicted to encode multiple LapA-like proteins. The multilocus sequence analysis (MLSA) phylogenetic tree here shows the clustering of representatives Pseudomonas species found in the GenBank database based on the analysis of concatenated alignments of 16S rRNA, gyrB, rpoB, and rpoD genes. Distance was calculated using the Jukes-Cantor model, and the tree was constructed using neighbor joining. The P. aeruginosa, P. fluorescens, and P. pertucinogena lineages described by Mulet et al. (64) are highlighted with the indicated colors. The namesake species of the groups described by García-Valdés and Lalucat (86) are in bold font. The P. aeruginosa and P. fluorescens lineages described by Mulet et al. (64) and the P. pertucinogena lineage described by Peix et al. (63) are also apparent in our tree and are indicated using the indicated shading (colored according to the lineages described by Peix et al. [63]). The most notable difference between the tree presented here and previously reported trees is the presence of a distinct P. luteola and P. duriflava clade, while Peix et al. (63) presented them as part of the monophyletic P. aeruginosa lineage. However, the placement of P. luteola within the P. aeruginosa lineage is not strongly supported. The study by Mulet et al. (64) placed P. luteola outside the P. aeruginosa lineage, and the bootstrap support for Peix et al. (63) positioning the P. luteola and P. duriflava clade within the P. aeruginosa lineage is less than 50%. Three other species were not present in previously published phylogenies of Pseudomonas and do not fit neatly into the three lineages described previously: P. pohangensis, P. hussainii, and P. acidophila. Both P. pohangensis and P. hussainii are positioned between the P. pertucinogena lineage and the other two lineages. P. acidophila is positioned outside the rest of the genus, consistent with a recent study that argued that P. acidophila should be reclassified as Paraburkholderia acidophila (87). While the P. pertucinogena lineage described by Peix et al. (63) is well supported by the tree we present here, the species P. pertucinogena is absent from our tree. This is because we included only species present in the GenBank database in our tree. At the time of writing, there is an available genome sequence record of P. pertucinogena (BioProject accession no. PRJNA235123), but the absence of an assembled genome from GenBank means that the organism was not included in our analysis of the distribution of LapA-like proteins. Nevertheless, the tree topology is similar overall to the previously reported trees outlined above.

