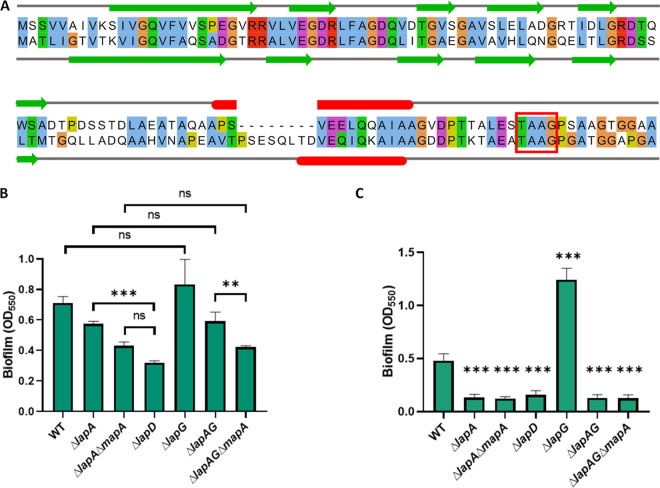
FIG 2.
LapD and LapG contribute to MapA-dependent biofilm formation. (A) Alignment of LapA and MapA N-terminal portions generated using MUSCLE (65) and visualized using Jalview (85) with secondary structure prediction using JPred4 (83). Similar residues are indicated by color. Predicted secondary structure is indicated by colored shapes: green arrows, beta sheets; red bars, alpha helix. The LapG processing site TAAG is indicated by a red box. (B) Quantification of biofilm assay assessing biofilm formation of adhesin and regulatory mutants grown for 16 h in KA medium. (C) Quantification of biofilm assay assessing biofilm formation of adhesin and regulatory mutants grown for 16 h in K10-T medium. For statistical tests, hypothesis testing was conducted in GraphPad Prism 8 using two-tailed t tests with Holm-Sidak’s multiple comparison correction. P values are indicated by asterisks as follows: **, P < 0.01; ***, P < 0.001; ns, P > 0.05. In panel C, all asterisks denote P values of t tests between WT and the indicated mutant with Holm-Sidak’s multiple comparison correction.

