FIG 3.

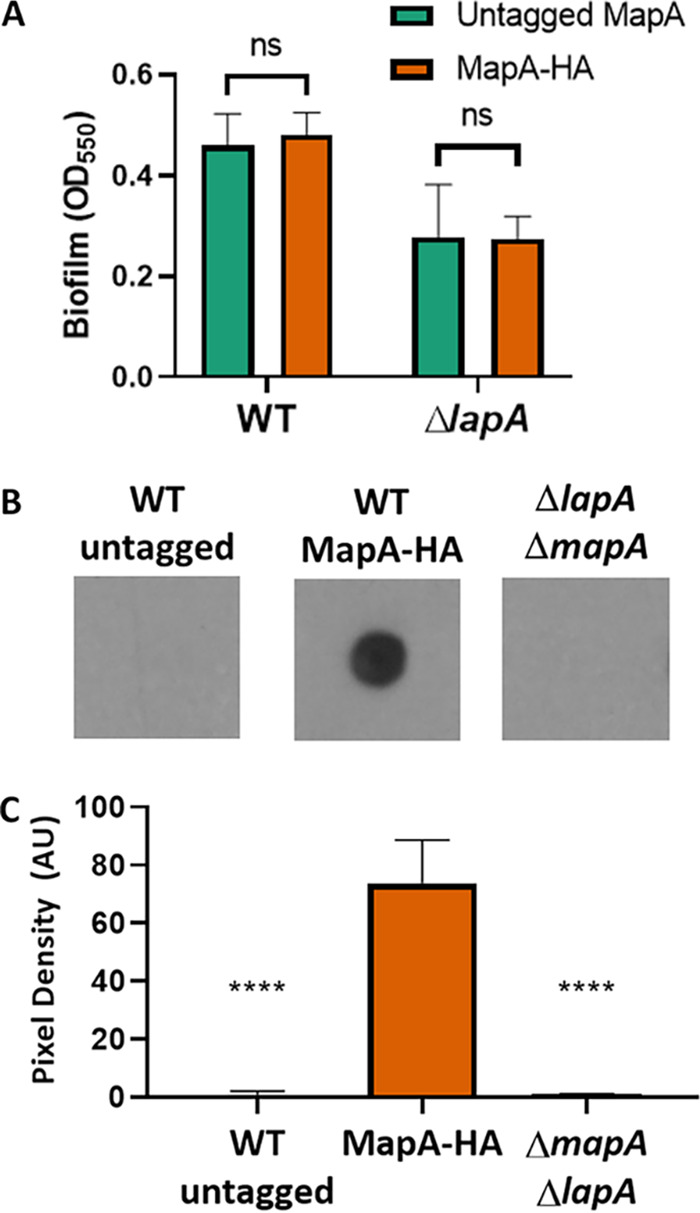
MapA is localized to the cell surface. (A) Quantification of crystal violet staining of wells of a 96-well plate after 16 h of growth in KA. Results for P. fluorescens Pf0-1 in both the untagged MapA and the tagged MapA variant bearing 3 tandem HA tags are shown. The phenotype is shown either in strains carrying a functional LapA or in a strain for which the lapA gene has been deleted. When compared using Student's t test, neither P. fluorescens Pf0-1 (P = 0.25) nor the ΔlapA mutant (P = 0.9) formed a significantly different level of biofilm when bearing an HA-tagged variant of MapA. (B) Representative dot blot of cell surface-localized MapA for the indicated strains. The WT (untagged strains) and a strain deleted for both the mapA and lapA genes serve as negative controls. (C) Three independent dot blot experiments were quantified using ImageJ as follows. The pixel values for the blots were inverted for ease of plotting. The region of interest (ROI) was defined for the control LapA dot blot (not shown), and then the mean gray value was determined for each spot using the predefined ROI. The background was subtracted from each spot; the background was determined by measuring the mean gray value in a section of the blot not containing any samples. The adjusted mean pixel density was plotted here for three biological replicates. There was a significant reduction in signal for both control strains compared to the strain expressing MapA-HA as assessed by t test. ****, P < 0.001; ns, P > 0.05.
