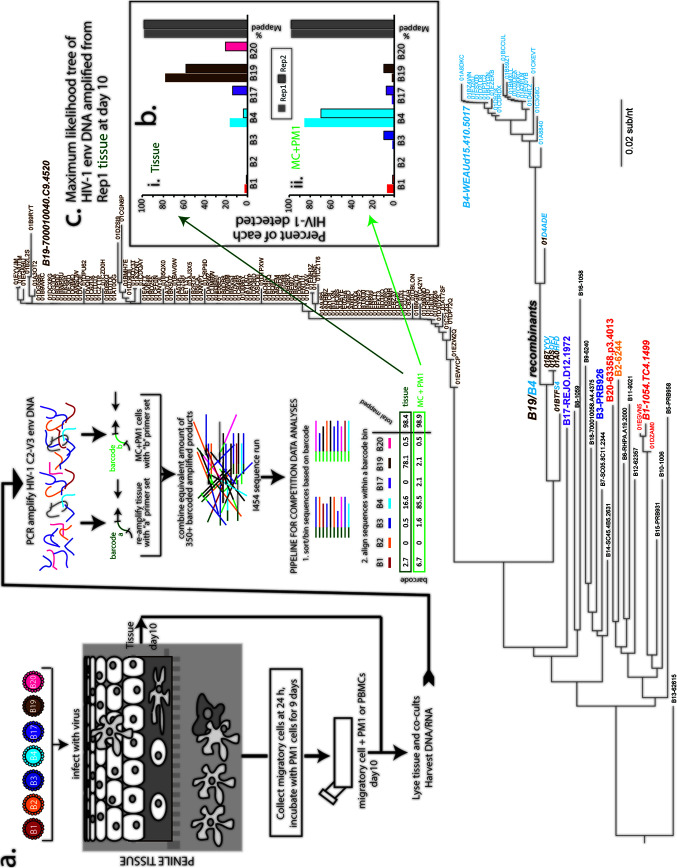
FIG 1.
Schematic of transmission fitness assay and analyses of multivirus infections. (a) Human explant tissue was exposed to a mixture of Envacute and Envchronic viruses for 3 h, washed, and cultured overnight. Cells migrating out of the tissue were collected and cocultured with PM1 CD4+ T cells. After10 days, both tissue and MC+PM1 cocultures were lysed, and DNA was extracted for PCR amplification of the C2-V3 envelope region. After ligation of barcoded oligonucleotides, purification, and quantification, equivalent amounts of products were subject to NGS. Data analysis was performed using SeekDeep, a custom pipeline sorting sequences based on barcodes and aligning sequences within barcode bins. (b) Results of multivirus infections are presented as percent sequence reads of each virus detected in the assay in tissue or MC+PM1 cocultures. Gray bars indicate the percentage of sequences from that barcoded PCR product (representing this multivirus competition) mapped to one of the seven viruses in the competitions. It is important to note that these analyses involve counting HIV isolates based on phylogenetic clustering, where low-frequency mutations do not impact the analyses. This was verified as shown in panel c. The relative amount of each virus in the competition was determined using maximum-likelihood trees of the HIV-1 C2-V3 env DNA amplified from tissue or MC+PM1 cocultures. Env sequence in the maximum likelihood tree of panel c in the bold and larger colored text and the black text represent the C3-V3 gp120 sequences of all the chimeric Env HIV-1 strains that were employed in the various multi-virus competitions used in this study (see below). For the representative multi-virus competition results shown in this figure, the Env chimeric viruses used in this competition are the branch points on the tree labeled with the colored text. The small text labels (text not important) show the individual branches/sequences defined as NGS reads "counted" from the multivirus competitions by SeekDeep. The reference sequences for the viruses in this competition are shown in italic, bold, large text, namely B1-1054.TC4.1499 (red), B2-6244 (yellow), B3-PRB926 (dark blue), B4-WEAUd15.410.5017 (light blue), B17-REJO.D12.1972 (purple), BB19-700010040.C9.4520 (brown), and B20-63358.p3.4013 (orange on the tree but pink for rest of figure). A few recombinant B19/B4 sequences were identified in this competition and were identified as a mixed brown/light blue text label. Of all HIV sequences in the maximum-likelihood tree (c) from the matched-input viruses (B1, B2, B3, B4, B19, and B20), only B1, B4, and B19 replicated in the tissue (see replicate 1 of the tissue in panel b). Less than 1%, or 4 sequences, were recombinants of B4 and B19 with different breakpoints.

