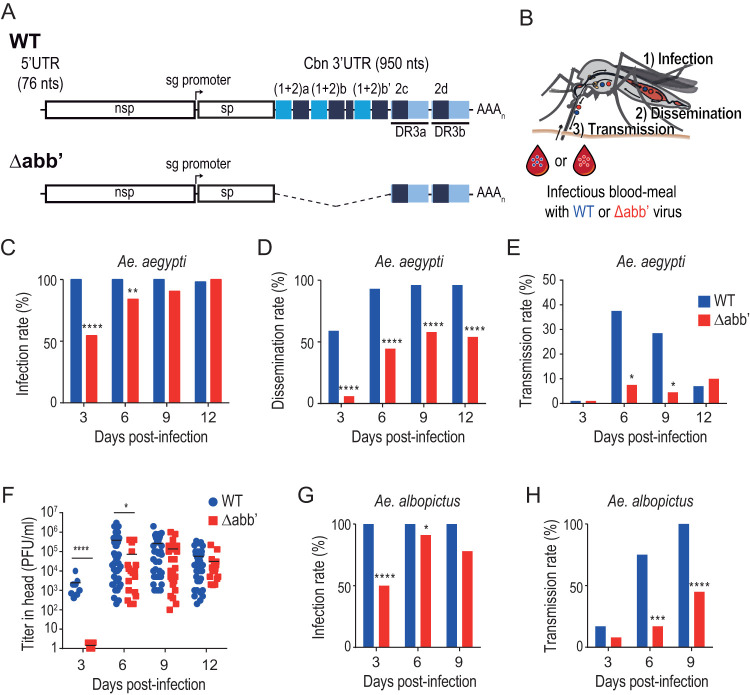
FIG 1.
Extrinsic incubation period of wild-type and Δabb′ mutant CHIKVs in Aedes mosquitoes. (A) Schematic representation of the genomes of wild-type (WT) and Δabb′ mutant viruses. The Δabb′ mutant bears a deletion of the first 500 nucleotides of the 3′ UTR. (B) Extrinsic incubation period of WT and Δabb′ CHIKVs. Mosquitoes were blood fed with 106 PFU/ml of WT or Δabb′ mutant viruses, and the presence of virus was analyzed in the body (as a proxy of the infection rate), the head (as a proxy of the rate of dissemination to salivary glands), and the saliva (indicative of the transmission rate) at different times postinfection. (C to E) Bar graphs showing infection, dissemination, and transmission rates of WT and Δabb′ viruses in infected Aedes aegypti mosquitoes. (C) The infection rate was calculated as the percentage of infected mosquito bodies at each time point. (D) The dissemination rate was scored as the number of infected mosquito heads over the number of infected bodies. (E) The transmission rate was measured as the ratio between the number of mosquito saliva samples with detectable virus and the number of mosquitoes in which dissemination was successful. Bars for infection, dissemination, and transmission rates represent cumulative data from two independent experiments (n = 48). Data were analyzed by Fisher’s exact test. (F) Dot plot showing mean viral titers and standard deviations (SD) of WT and Δabb′ viruses in the heads of infected mosquitoes. Infectious virus titers were measured in the heads of mosquitoes displaying positive CPE at each time point by plaque assays in Vero cells. Data represent the titers in individual mosquitoes. Statistics were performed by a Mann-Whitney U test. (G and H) Infection and dissemination rates in Aedes albopictus mosquitoes. Bar graphs for infection (G) and dissemination (H) rates are shown (n = 24). Data were analyzed by Fisher’s exact test.

