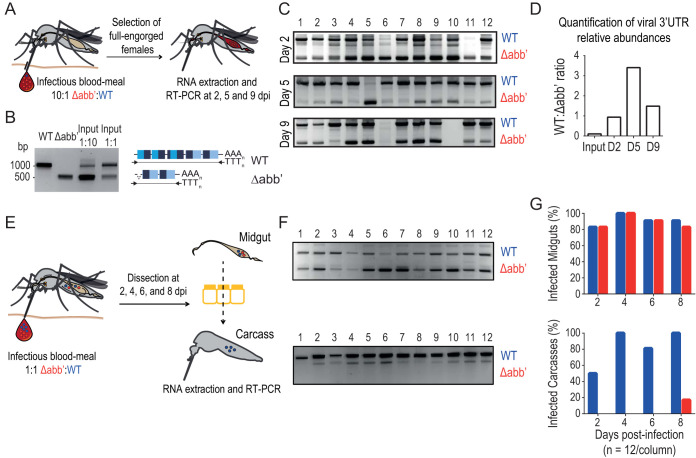
FIG 5.
Wild-type CHIKV has a fitness advantage over Δabb′ CHIKV to cross the midgut escape barrier. (A) Experimental setup of wild-type (WT) versus Δabb′ competitions in Aedes aegypti mosquitoes. Mosquitoes were offered an infectious blood meal containing a mixture of WT and Δabb′ viruses in a 1:10 ratio (106 PFU/ml). Total RNA was purified from individual mosquitoes at different time points postinfection, and the presence of WT and Δabb′ 3′ UTRs was assessed. (B) The RT-PCR product of the RNA extracted from the infectious blood meal containing wild-type and Δabb′ viruses in 1:1 and 1:10 ratios was resolved alongside fragments corresponding to wild-type and Δabb′ 3′ UTRs for reference. (C) Agarose gel electrophoresis of 3′-UTR amplification products from individual mosquitoes. The presence of WT and Δabb′ viruses was assessed by RT-PCR and agarose gel electrophoresis on 12 individual mosquitoes at three different times after the blood meal. (D) Bar graph showing the ratio of WT to Δabb′ 3′ UTRs in the input and in mosquito individuals during the time course of the experiment. Bars represent the average ratios of intensities for the bands corresponding to the products of amplification of WT and Δabb′ 3′ UTRs in individual mosquitoes at each time point. (E) Competition assays to assess the ability of WT and Δabb′ CHIKVs to cross the midgut escape barrier. Infectious blood feeding of A. aegypti mosquitoes was performed with blood containing a mixture of both viruses at a 1:1 ratio (106 PFU/ml). At different times postinfection, the midgut and carcass were dissected, total RNA was extracted, and the presence of virus was evaluated by RT-PCR as described above. (F) Representative agarose gels showing the products of amplification from midgut (top) and carcass (bottom) samples of 12 individual mosquitoes at 4 days postinfection. (G, top) Bar graph showing the presence of WT and Δabb′ viruses in the midgut as a function of time. Bars represent the percentages of midguts where WT and Δabb′ viruses were detected. (Bottom) Bar graph showing the presence of WT and/or Δabb′ viruses in carcasses as a function of time. Bars represent the percentages of carcasses where WT and/or Δabb′ viruses were detected.

