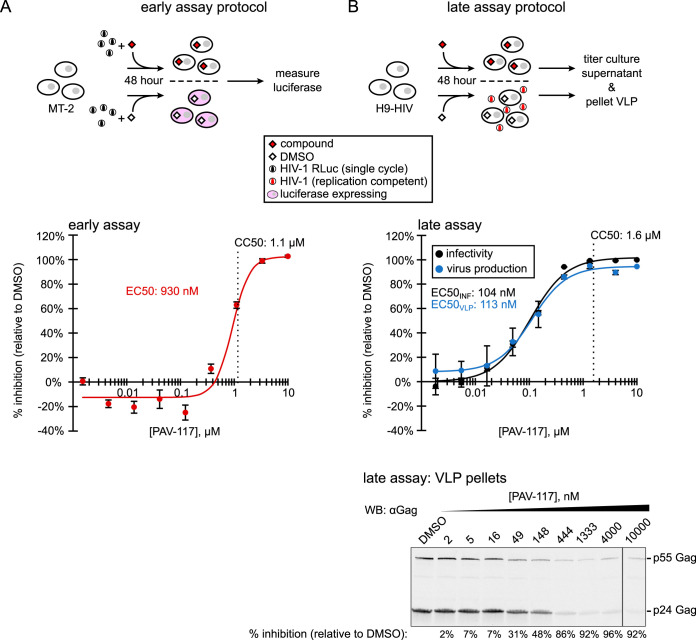
FIG 3.
PAV-117 acts late in the HIV-1 life cycle, inhibiting virus production but not specific infectivity. (A) Schematic of the early assay, which measures effects on viral entry through early viral gene expression. MT-2 cells were infected with the single-round HIV-1 pNL4-3 RLuc virus (env-deleted and pseudotyped with HIV-1 NL4-3 Env) in the presence of compound or DMSO. After 48 h, luciferase activity was measured and used to calculate inhibition of HIV-1 infection relative to the DMSO control (% inhibition). The graph shows the dose-response curve for inhibition of HIV-1 early events by PAV-117 that was generated using this assay and used to determine the EC50. The CC50 was determined in parallel using uninfected MT-2 T cells and is marked by a vertical dashed line. Error bars in the graph show the SEM determined from three replicates. (B) Schematic of the late assays, which measure the effects on viral late events, starting with the expression of Gag and GagPol through virus release and maturation. Chronically infected H9 T cells (H9-HIV) were treated with either compound or DMSO, and media collected 48 h later were used for two assays: (i) to quantify inhibition of HIV-1 infectivity relative to DMSO control by titering on TZM-bl cells (black curve, used to calculate the EC50 for the inhibition of infectivity) and (ii) to quantify inhibition of virus production by pelleting virus for Western blot (WB) with antibody to HIV-1 Gag (αGag; blue curve, used to calculate the EC50 for the inhibition of virus production). The CC50 was determined in the inhibition assay and is marked by a vertical dashed line. A representative αGag WB of virus pellets is shown below the dose-response graph, with DMSO treatment or concentration of PAV-117 indicated above each WB lane and the percent inhibition of virus production (relative to the DMSO-treated control) indicated below each lane. The error bars in panels A and B show the SEM determined from two replicates.

