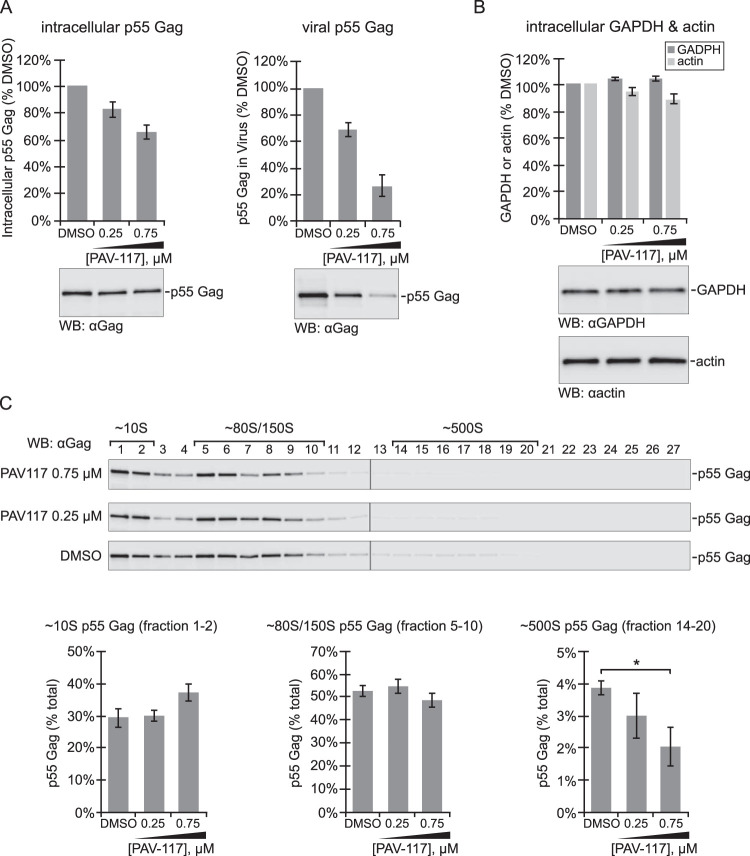
FIG 4.
PAV-117 appears to act during the HIV-1 assembly pathway, after formation of the ∼80S/150S intermediate. MT-2 cells were infected with HIV-1 LAI pro– Δenv (pseudotyped with HIV-1 NL4-3 Env) and treated with DMSO or the indicated concentrations of PAV-117 for 48 h. (A) Cell lysates and media were harvested to analyze effects on intracellular steady-state p55 Gag levels and p55 Gag in VLP, as indicated, using WB with Gag antibody (αGag) to quantify p55 Gag (no p24 was produced due to the use of a protease-deficient virus for infection). (B) Cell lysates were also analyzed for intracellular steady-state levels of two cellular proteins, GAPDH and actin, by WB with αGAPDH and αactin. For panels A and B, the data in the graphs are shown as the percentage of DMSO-treated controls, with error bars showing the SEM from three replicates, and representative WBs are shown below graphs. (C) To quantify intracellular steady-state levels of assembly intermediates, cell lysates from panels A and B were also analyzed by velocity sedimentation, followed by WB of each gradient fraction with αGag. Fraction numbers are indicated above the WB panels, with migration of specific assembly intermediates indicated by brackets above. Graphs show quantification of p55 Gag in fractions containing the ∼10S, ∼80S/150S, and ∼500S intermediates as percentages of the total p55 Gag in the gradient. The expected migration of each protein in WB panels is indicated on the right. Error bars show the SEM determined from three replicates. The ∼500S intermediate is the only intermediate for which a significant difference is observed between the DMSO and 0.75 μM PAV-117 groups, as indicated by an asterisk (P < 0.05).

