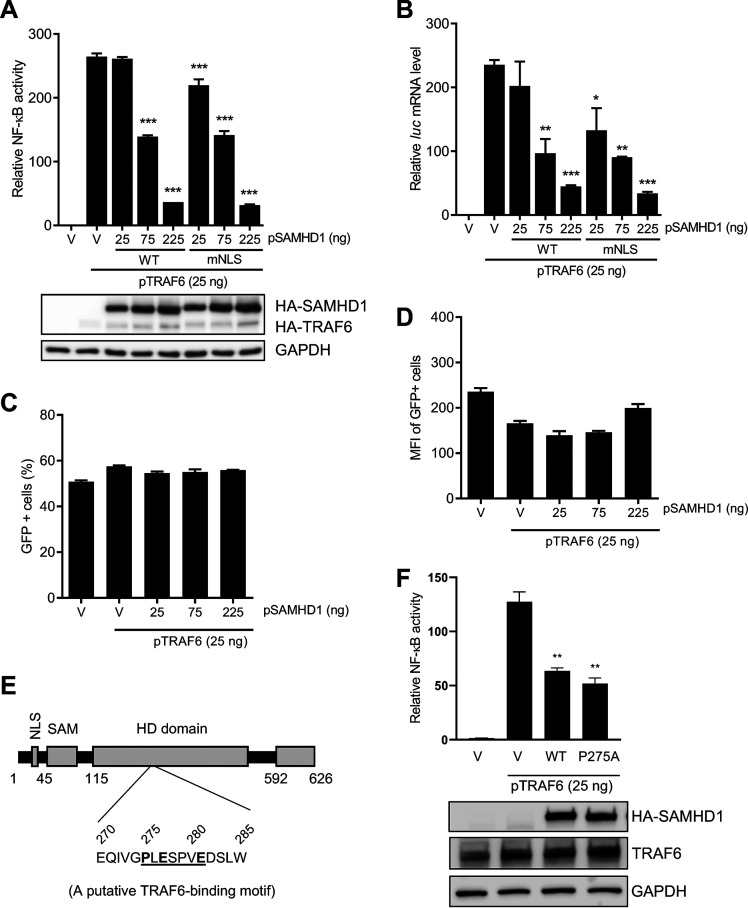
FIG 2.
Cytoplasmic SAMHD1 inhibits TRAF6-mediated activation of NF-κB signaling. (A) HEK293T cells were cotransfected with the indicated amounts of pRK-HA-TRAF6, wild-type (WT) or mutant NLS (mNLS) pCG-F-HA-SAMHD1 (pSAMHD1), 50 ng pNF-κB-luciferase, and 5 ng of pcDNA3-GFP. The total amount of DNA was maintained through the addition of empty vector (V). Cell lysates were collected for luciferase assay and immunoblotting 24 h posttransfection. All luciferase values were normalized to 10 μg protein. Relative NF-κB activity was calculated by setting empty vector-transfected cells as 1. HA antibody was used to detect expression of SAMHD1 and TRAF6. GAPDH was used as a loading control. (B) Samples from the experiment in panel A were collected to measure firefly luciferase (luc) mRNA by RT-qPCR. Graphs depict data derived from triplicate samples, and error bars represent SEM. Statistical analysis was performed by one-way analysis of variance (ANOVA) with Dunnett's multiple-comparison posttest. (C and D) Samples from the experiment in panel A were collected to monitor GFP expression by flow cytometry. Graphs depict data derived from triplicate samples, and error bars represent SD. Statistical analysis was performed by unpaired t test with Welch’s correction. MFI, mean fluorescence intensity. (E) Schematic representation of human SAMHD1 protein highlighting its TRAF6 putative binding motif (275PXEXXXE281). (F) HEK293T cells were cotransfected with pRK-HA-TRAF6 (25 ng), wild-type (WT) or mutant P275A pCG-F-HA-SAMHD1 (pSAMHD1), and 50 ng pNF-κB-luciferase. Empty vector (V) without (the first V) or with pRK-HA-TRAF6 (the second V) were used as negative and positive controls. Cell lysates were collected for luciferase assay (top bar chart) and immunoblotting (bottom blots) at 24 h posttransfection. An anti-HA antibody was used to detect expression of HA-tagged SAMHD1. GAPDH was used as a loading control. Graphs depict data derived from triplicate samples, and error bars represent SD. Statistical analysis was performed by unpaired t test with Welch’s correction. *, P ≤ 0.05; **, P ≤ 0.01; ***, P ≤ 0.001.

