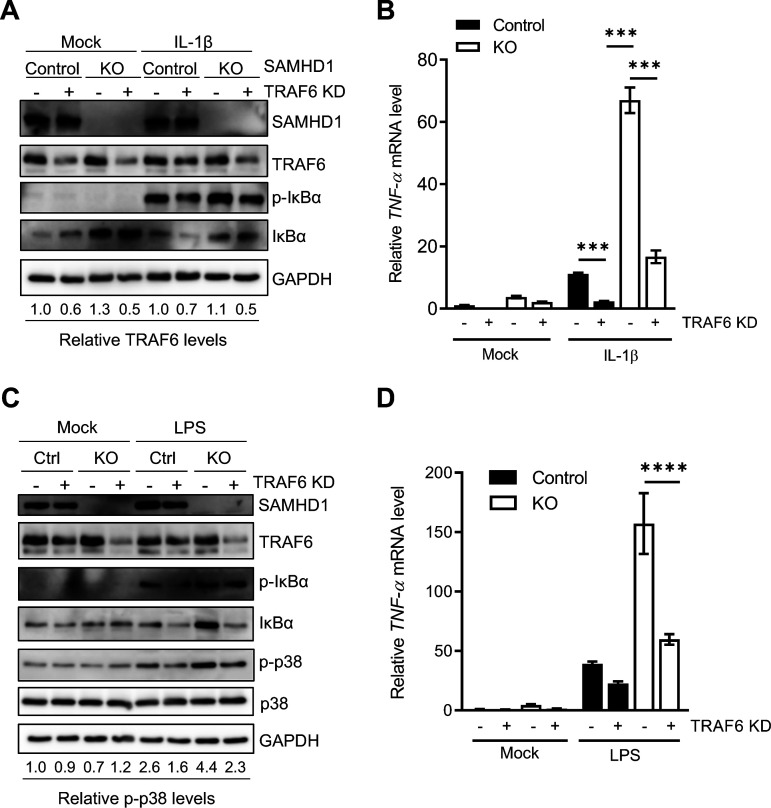
FIG 3.
TRAF6 KD reduces NF-κB and p38 activation in SAMHD1 KO cells. (A) Stable THP-1 control or SAMHD1 KO cells lines with either control or TRAF6 KD were cultured in standard media and mock treated or stimulated with IL-1β. Cells were harvested 10 min poststimulation and lysed for immunoblotting. Relative TRAF6 protein levels were calculated by densitometry analysis. The TRAF6 signal was normalized to GAPDH. Untreated control cells were set as 1. (B) Samples for RT-qPCR and mRNA analysis were collected 2 h poststimulation. Data represent triplicate samples, and error bars depict SEM. Statistical analysis was performed by two-way ANOVA. (C) THP-1 control or SAMHD1 KO cells lines with either control or TRAF6 KD were cultured in standard media and mock treated or stimulated with LPS. After 6 h, cells were harvested and lysed for immunoblotting. Relative levels of phosphorylated p38 (p-p38) were calculated by densitometry analysis. The p-p38 signal was normalized to total p38 protein and GAPDH. Mock-treated, unstimulated control cells were set as 1. (D) TNF-α mRNA levels were quantified by RT-qPCR and normalized to spliced GAPDH. The graph depicts data derived from triplicate samples, and error bars represent SEM. Statistical analysis was performed by two-way ANOVA with Tukey’s multiple-comparison posttest. ****, P ≤ 0.0001.

