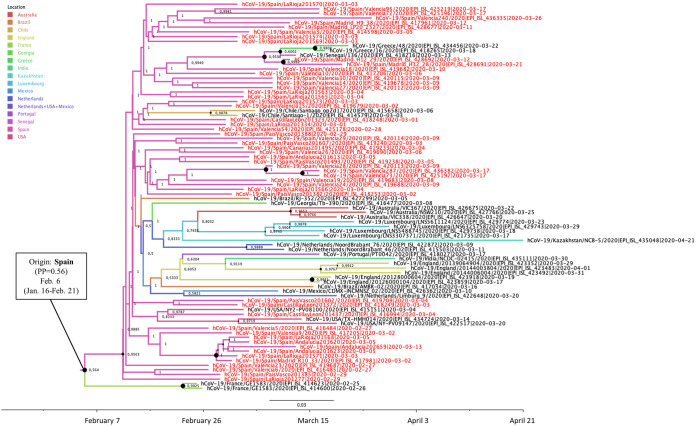
FIG 3.
Maximum clade credibility (MCC) tree of cluster 19B-Sp2. Branch colors indicate the most probable location of the MRCA, and node labels indicate the posterior probability supporting the estimated MRCA location. Node support values are indicated by node size (only nodes with PP of ≥0.8 are considered well supported). The scale axis represents estimated dating of the MRCA for each cluster, and label spacing defines exactly 9.16 days from the most recent sample included in the analysis.

