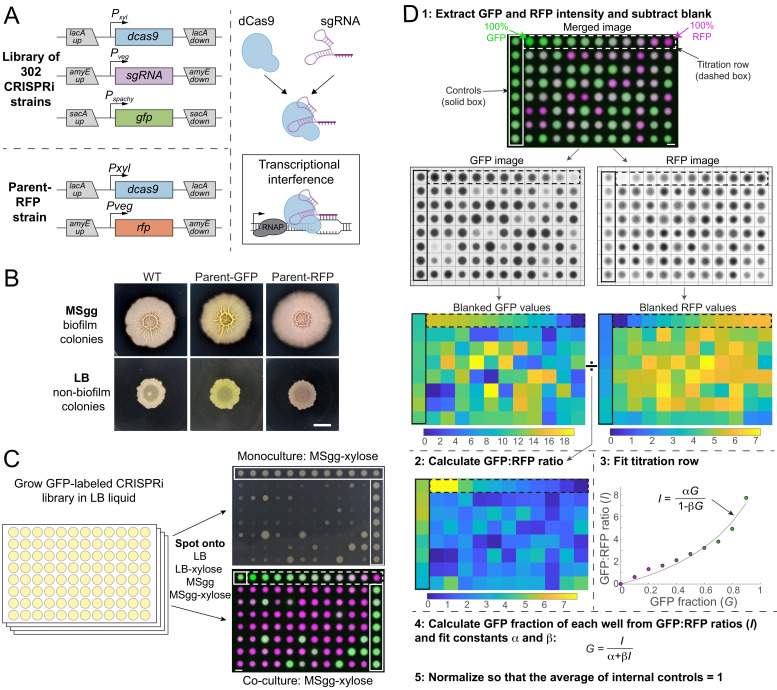
Figure 1. A high-throughput screening strategy to measure colony-based competition within bacterial colonies.
(A) We constructed a GFP-labeled library of CRISPR interference (CRISPRi) knockdowns of all known essential and conditionally essential genes (top left). In the library, the nuclease-deactivated Cas9 gene (dcas9) is inducible with xylose and the single-guide RNA (sgRNA) is constitutively expressed. dCas9 binds the sgRNA and blocks transcription by physically impeding RNA polymerase (right). Every strain is labeled with gfp expressed from the sacA locus. A parent strain (parent-RFP, bottom left) that expresses rfp as well as dCas9 without an sgRNA was used in competition assays. (B) The parent-GFP (sacA::gfp, lacA::dCas9) and parent-RFP strains have similar phenotypes to wild type on both biofilm-promoting MSgg agar and non-biofilm-promoting LB agar. Cultures were grown in liquid LB to an optical density (OD600) ~1, and then 1 µL was spotted in the middle of wells of a six-well plate containing LB agar or MSgg agar. Image intensities were adjusted identically; the yellow and red colors of the parent strains are due to GFP and RFP expression, respectively. Scale bar: 5 mm. (C) Schematic of screening strategy to measure the monoculture colony size and competitive fitness of each knockdown against the parent-RFP strain. GFP-labeled knockdown libraries were grown in liquid culture in 96-well microtiter plates. Monocultures were spotted onto LB and MSgg agar plates (top right) without or with xylose to achieve basal or full knockdown, respectively, of the targeted gene. The monoculture plates contained parent controls in wells along an outer column and row (solid box). Co-cultures of a 1:1 volumetric mixture of the parent-RFP and GFP-labeled library strains were spotted onto agar plates of LB and MSgg, without or with xylose. Controls in which parent-GFP was mixed with parent-RFP are bounded by horizontal red box. Bottom right: merged image of RFP and GFP signals from co-cultures. The co-cultures include a titration row from 100% GFP cultures to 100% RFP cultures in 10% increments (dashed box), and several controls of 1:1 mixtures of the parent GFP and parent-RFP strains (purple box). Scale bar: 5 mm. (D) Schematic of image analysis to quantify competitive fitnesses from the co-culture screen. Data from plate 1 spotted on MSgg is presented as an example. Plates were segmented and individual colony intensities were extracted from the GFP and RFP images. GFP intensities were divided by RFP intensities to obtain ratios I. The titration row (dashed box) was fit to a curve using the equation I=αG/(1−βG), where G is the fraction of the parent-GFP strain, to extract fit parameters α and β for each plate individually. These parameters were used to map the GFP fractions of each colony and values were normalized so that the parent-GFP:parent-RFP control co-cultures on each plate (solid box) had an average value of 1. Scale bar 5 mm.


