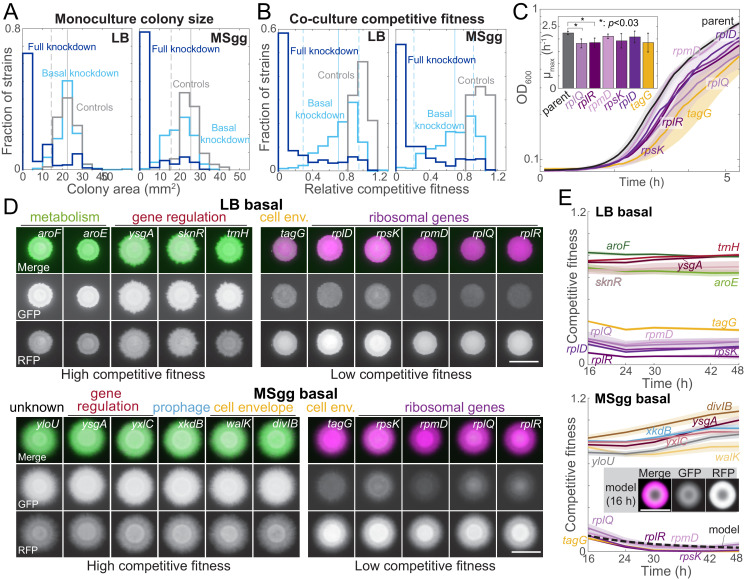
Figure 2. Growth on biofilm-promoting medium, increased knockdown, and competition against parent-RFP all broaden the distribution of fitnesses across the library.
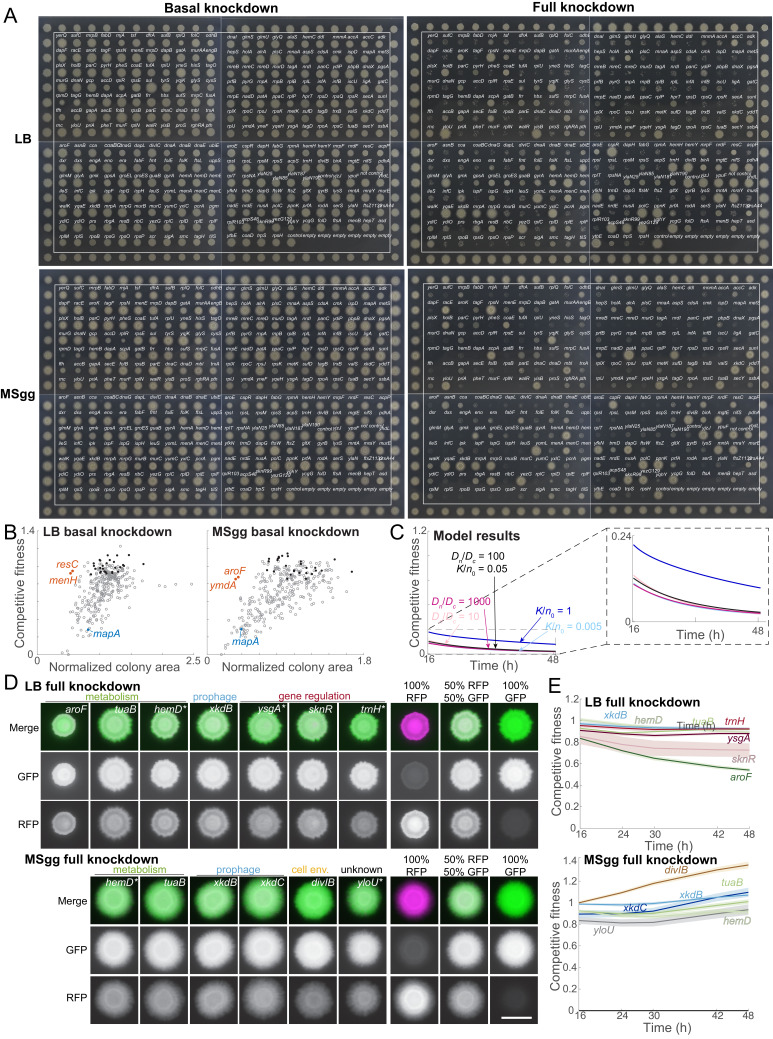
(A) Basal knockdown (light blue) of essential genes on LB agar (which does not promote biofilms) resulted in similar colony sizes as parent-GFP controls (gray); only 13 of 302 colonies had a colony size two standard deviations below the mean of the controls. By contrast, on biofilm-promoting MSgg agar the distribution of colony sizes spread to smaller values, with 80 colonies more than two standard deviations below the mean of the controls. Full knockdown (dark blue) inhibited growth of most strains. Data are from measurements at 16 hr using the sacA::gfp library. Vertical solid lines are means of the control distributions, and dashed lines show two standard deviations below the mean. (B) 17 (LB) and 11 (MSgg) knockdown strains in the library competed poorly against the parent-RFP strain at basal knockdown (light blue), while 41 (LB) and 46 (MSgg) had competitive fitness similar to parent-GFP+parent-RFP controls (gray) even at full knockdown (dark blue). Data are from competition ratios at 16 hr using the sacA::gfp library. Low-fitness strains were defined as having fitness at least two standard deviations below the mean of the data, and neutral-fitness strains were defined as having fitness at least one standard deviation above the mean. Vertical solid lines are means of the distribution from basal knockdown, and dashed lines show two standard deviations below and one standard deviation above the mean. (C) Strains with low competitive fitness for basal knockdown generally had lower growth rates in liquid monoculture than parent control strains. Colonies were inoculated into liquid LB, and OD600 was monitored over time. Ribosome-related genes are shown in shades of purple, and a cell envelope-related gene (tagG) is shown in yellow. Curves are means, and shaded regions represent one standard deviation (n = 3). Inset: maximum growth rates. *: p<0.03, Student’s unpaired t-test with a Benjamini–Hochberg multiple-hypothesis correction. (D) On both LB and MSgg agar, basal knockdown of ygsA, which is involved in gene regulation, exhibited high competitive fitness (left) and tagG and ribosomal-gene knockdowns exhibited low competitive fitness (right). GFP (knockdown strain) is false-colored green, and RFP (parent) is false-colored magenta. Images are from 16 hr using the sacA::gfp library. Scale bar: 5 mm. (E) Competitive fitness of the strains with the highest and lowest values was approximately constant after 16 hr. Curves are means, and shaded regions represent one standard error of the mean (n = 3 independent measurements). Inset and dashed black line: a reaction-diffusion model of co-culture colony growth with physically realistic parameters indicates that knockdowns (magenta) with maximum growth rate 20% lower than the parent (green) reproduce the colony size (bottom, inset) and competitive fitness (bottom, dashed black line) of ribosomal protein knockdowns after 16 hr (Materials and methods, Figure 2—figure supplement 1C).


