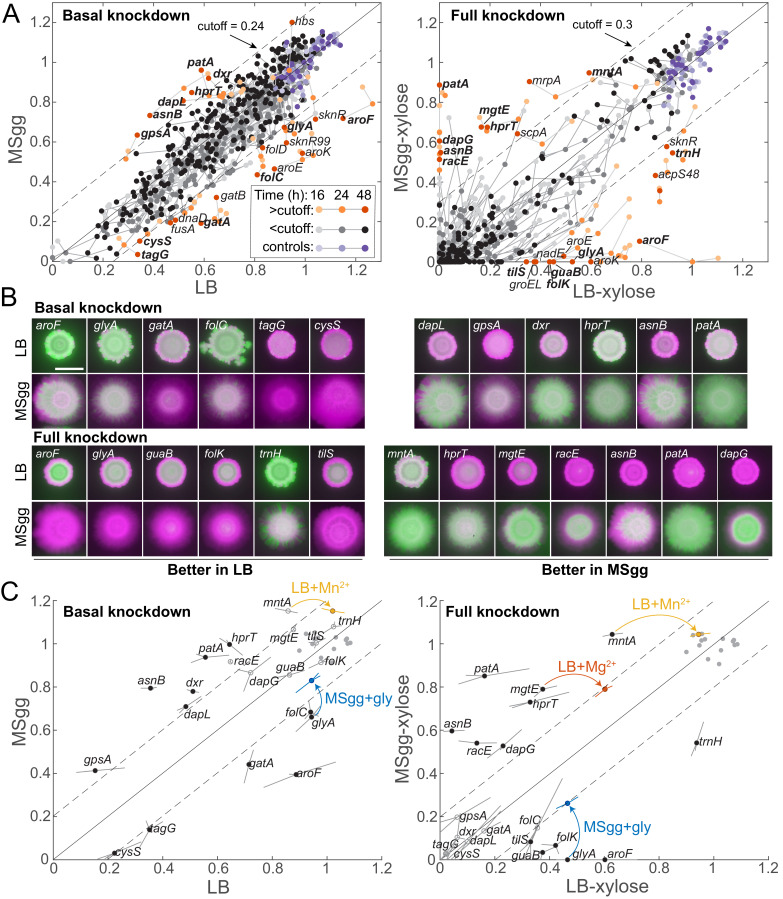
Figure 3. Some media-specific differences in competitive fitness can be directly attributed to the nutrient composition of the media.
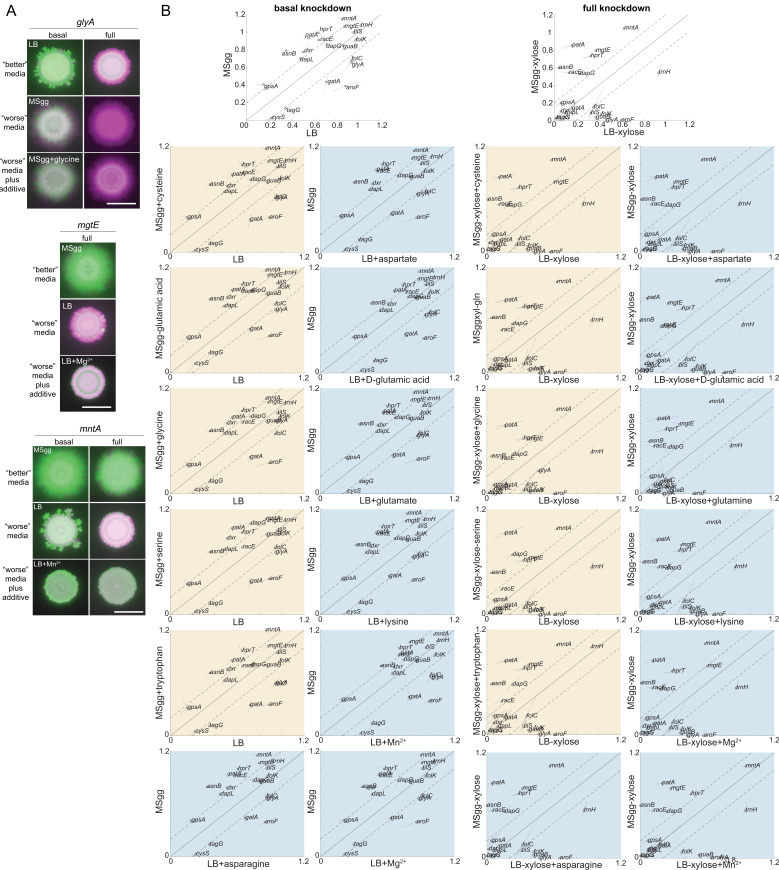
(A) Although most knockdowns had similar fitness on LB and MSgg agar, a subset of knockdowns had higher competitive fitness on LB agar than on MSgg agar, or vice versa. Genes with fitness difference >0.24 at 24 hr or >0.3 at 48 hr are annotated and colored in orange shades, while those below the cutoff are in grayscale and parent-RFP+parent-GFP co-culture controls are in shades of purple. Genes labeled in bold were selected for follow-up studies. Data are from the sacA::gfp library at 16, 24, and 48 hr. The solid line is y=x, and the dotted lines represent the chosen cutoff. (B) Images of colonies of the bolded genes in A after 48 hr that illustrate the differential competitive fitness between LB and MSgg. Green and magenta represent fluorescence from the gene knockdown and parent, respectively. Scale bar: 5 mm. (C) Addition of specific nutrients to the medium with lower competitive fitness rescued fitness for the mntA, glyA, and mgtE knockdowns. Means (circles) of triplicates (shown at the end of lines extending from the circle) are displayed. Filled black circles represent gene knockdowns that had substantially different competitive fitness in LB and MSgg. Open gray circles represent other genes tested that were not identified as different in that condition. Parent-RFP+parent-GFP controls are shown as gray filled circles. Data from addition experiments (LB+manganese, LB+magnesium, and MSgg+glycine for mntA, mgtE, and glyA, respectively) are shown as colored circles and lines at the ends of arrows. All changes marked with arrows are significant after correcting for multiple hypotheses with the Benjamini–Hochberg method (p<0.01, Student’s unpaired t-test). Genes without a colored circle and arrow indicate that the fitness of that knockdown did not change upon addition of any of the nutrients tested (Figure 3—figure supplement 1).


