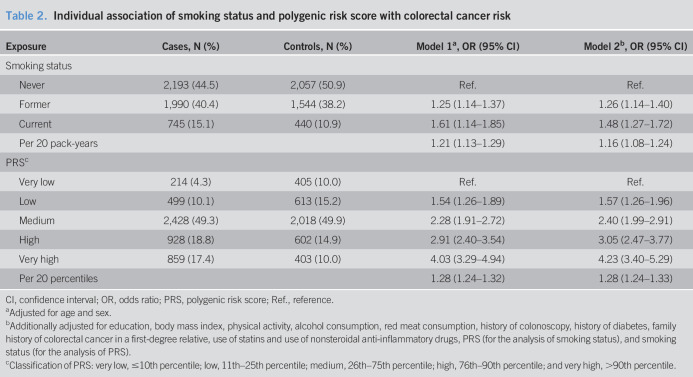
Table 2.
Individual association of smoking status and polygenic risk score with colorectal cancer risk
| Exposure | Cases, N (%) | Controls, N (%) | Model 1a, OR (95% CI) | Model 2b, OR (95% CI) |
| Smoking status | ||||
| Never | 2,193 (44.5) | 2,057 (50.9) | Ref. | Ref. |
| Former | 1,990 (40.4) | 1,544 (38.2) | 1.25 (1.14–1.37) | 1.26 (1.14–1.40) |
| Current | 745 (15.1) | 440 (10.9) | 1.61 (1.14–1.85) | 1.48 (1.27–1.72) |
| Per 20 pack-years | 1.21 (1.13–1.29) | 1.16 (1.08–1.24) | ||
| PRSc | ||||
| Very low | 214 (4.3) | 405 (10.0) | Ref. | Ref. |
| Low | 499 (10.1) | 613 (15.2) | 1.54 (1.26–1.89) | 1.57 (1.26–1.96) |
| Medium | 2,428 (49.3) | 2,018 (49.9) | 2.28 (1.91–2.72) | 2.40 (1.99–2.91) |
| High | 928 (18.8) | 602 (14.9) | 2.91 (2.40–3.54) | 3.05 (2.47–3.77) |
| Very high | 859 (17.4) | 403 (10.0) | 4.03 (3.29–4.94) | 4.23 (3.40–5.29) |
| Per 20 percentiles | 1.28 (1.24–1.32) | 1.28 (1.24–1.33) |
CI, confidence interval; OR, odds ratio; PRS, polygenic risk score; Ref., reference.
Adjusted for age and sex.
Additionally adjusted for education, body mass index, physical activity, alcohol consumption, red meat consumption, history of colonoscopy, history of diabetes, family history of colorectal cancer in a first-degree relative, use of statins and use of nonsteroidal anti-inflammatory drugs, PRS (for the analysis of smoking status), and smoking status (for the analysis of PRS).
Classification of PRS: very low, ≤10th percentile; low, 11th–25th percentile; medium, 26th–75th percentile; high, 76th–90th percentile; and very high, >90th percentile.

