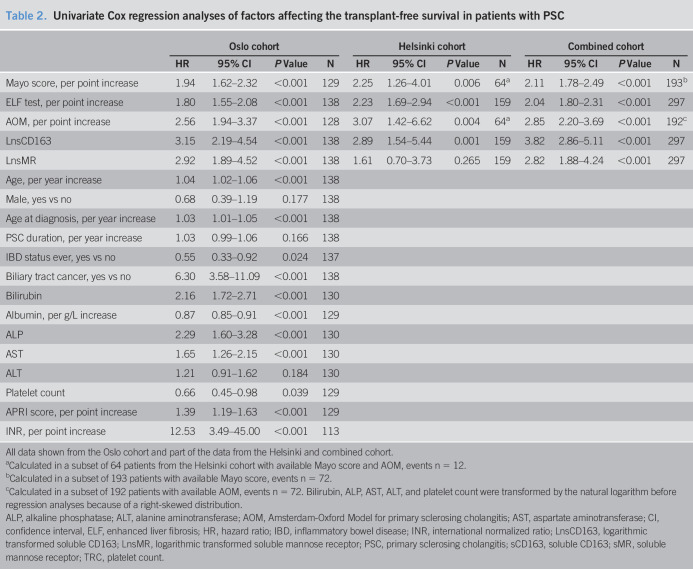
Table 2.
Univariate Cox regression analyses of factors affecting the transplant-free survival in patients with PSC
| Oslo cohort | Helsinki cohort | Combined cohort | ||||||||||
| HR | 95% CI | P Value | N | HR | 95% CI | P Value | N | HR | 95% CI | P Value | N | |
| Mayo score, per point increase | 1.94 | 1.62–2.32 | <0.001 | 129 | 2.25 | 1.26–4.01 | 0.006 | 64a | 2.11 | 1.78–2.49 | <0.001 | 193b |
| ELF test, per point increase | 1.80 | 1.55–2.08 | <0.001 | 138 | 2.23 | 1.69–2.94 | <0.001 | 159 | 2.04 | 1.80–2.31 | <0.001 | 297 |
| AOM, per point increase | 2.56 | 1.94–3.37 | <0.001 | 128 | 3.07 | 1.42–6.62 | 0.004 | 64a | 2.85 | 2.20–3.69 | <0.001 | 192c |
| LnsCD163 | 3.15 | 2.19–4.54 | <0.001 | 138 | 2.89 | 1.54–5.44 | 0.001 | 159 | 3.82 | 2.86–5.11 | <0.001 | 297 |
| LnsMR | 2.92 | 1.89–4.52 | <0.001 | 138 | 1.61 | 0.70–3.73 | 0.265 | 159 | 2.82 | 1.88–4.24 | <0.001 | 297 |
| Age, per year increase | 1.04 | 1.02–1.06 | <0.001 | 138 | ||||||||
| Male, yes vs no | 0.68 | 0.39–1.19 | 0.177 | 138 | ||||||||
| Age at diagnosis, per year increase | 1.03 | 1.01–1.05 | <0.001 | 138 | ||||||||
| PSC duration, per year increase | 1.03 | 0.99–1.06 | 0.166 | 138 | ||||||||
| IBD status ever, yes vs no | 0.55 | 0.33–0.92 | 0.024 | 137 | ||||||||
| Biliary tract cancer, yes vs no | 6.30 | 3.58–11.09 | <0.001 | 138 | ||||||||
| Bilirubin | 2.16 | 1.72–2.71 | <0.001 | 130 | ||||||||
| Albumin, per g/L increase | 0.87 | 0.85–0.91 | <0.001 | 129 | ||||||||
| ALP | 2.29 | 1.60–3.28 | <0.001 | 130 | ||||||||
| AST | 1.65 | 1.26–2.15 | <0.001 | 130 | ||||||||
| ALT | 1.21 | 0.91–1.62 | 0.184 | 130 | ||||||||
| Platelet count | 0.66 | 0.45–0.98 | 0.039 | 129 | ||||||||
| APRI score, per point increase | 1.39 | 1.19–1.63 | <0.001 | 129 | ||||||||
| INR, per point increase | 12.53 | 3.49–45.00 | <0.001 | 113 | ||||||||
All data shown from the Oslo cohort and part of the data from the Helsinki and combined cohort.
Calculated in a subset of 64 patients from the Helsinki cohort with available Mayo score and AOM, events n = 12.
Calculated in a subset of 193 patients with available Mayo score, events n = 72.
Calculated in a subset of 192 patients with available AOM, events n = 72. Bilirubin, ALP, AST, ALT, and platelet count were transformed by the natural logarithm before regression analyses because of a right-skewed distribution.
ALP, alkaline phosphatase; ALT, alanine aminotransferase; AOM, Amsterdam-Oxford Model for primary sclerosing cholangitis; AST, aspartate aminotransferase; CI, confidence interval, ELF, enhanced liver fibrosis; HR, hazard ratio; IBD, inflammatory bowel disease; INR, international normalized ratio; LnsCD163, logarithmic transformed soluble CD163; LnsMR, logarithmic transformed soluble mannose receptor; PSC, primary sclerosing cholangitis; sCD163, soluble CD163; sMR, soluble mannose receptor; TRC, platelet count.

