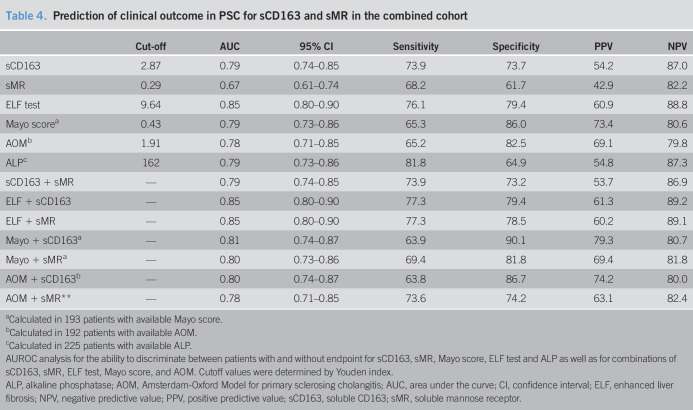
Table 4.
Prediction of clinical outcome in PSC for sCD163 and sMR in the combined cohort
| Cut-off | AUC | 95% CI | Sensitivity | Specificity | PPV | NPV | |
| sCD163 | 2.87 | 0.79 | 0.74–0.85 | 73.9 | 73.7 | 54.2 | 87.0 |
| sMR | 0.29 | 0.67 | 0.61–0.74 | 68.2 | 61.7 | 42.9 | 82.2 |
| ELF test | 9.64 | 0.85 | 0.80–0.90 | 76.1 | 79.4 | 60.9 | 88.8 |
| Mayo scorea | 0.43 | 0.79 | 0.73–0.86 | 65.3 | 86.0 | 73.4 | 80.6 |
| AOMb | 1.91 | 0.78 | 0.71–0.85 | 65.2 | 82.5 | 69.1 | 79.8 |
| ALPc | 162 | 0.79 | 0.73–0.86 | 81.8 | 64.9 | 54.8 | 87.3 |
| sCD163 + sMR | — | 0.79 | 0.74–0.85 | 73.9 | 73.2 | 53.7 | 86.9 |
| ELF + sCD163 | — | 0.85 | 0.80–0.90 | 77.3 | 79.4 | 61.3 | 89.2 |
| ELF + sMR | — | 0.85 | 0.80–0.90 | 77.3 | 78.5 | 60.2 | 89.1 |
| Mayo + sCD163a | — | 0.81 | 0.74–0.87 | 63.9 | 90.1 | 79.3 | 80.7 |
| Mayo + sMRa | — | 0.80 | 0.73–0.86 | 69.4 | 81.8 | 69.4 | 81.8 |
| AOM + sCD163b | — | 0.80 | 0.74–0.87 | 63.8 | 86.7 | 74.2 | 80.0 |
| AOM + sMR** | — | 0.78 | 0.71–0.85 | 73.6 | 74.2 | 63.1 | 82.4 |
Calculated in 193 patients with available Mayo score.
Calculated in 192 patients with available AOM.
Calculated in 225 patients with available ALP.
AUROC analysis for the ability to discriminate between patients with and without endpoint for sCD163, sMR, Mayo score, ELF test and ALP as well as for combinations of sCD163, sMR, ELF test, Mayo score, and AOM. Cutoff values were determined by Youden index.
ALP, alkaline phosphatase; AOM, Amsterdam-Oxford Model for primary sclerosing cholangitis; AUC, area under the curve; CI, confidence interval; ELF, enhanced liver fibrosis; NPV, negative predictive value; PPV, positive predictive value; sCD163, soluble CD163; sMR, soluble mannose receptor.

