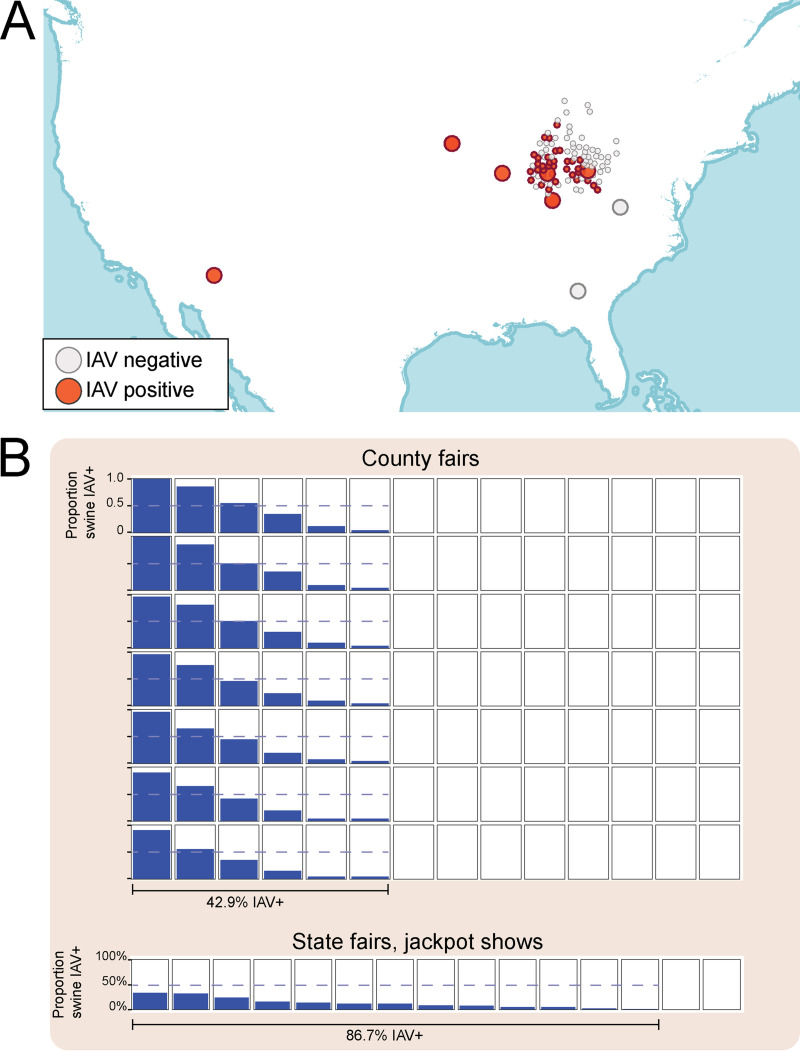
FIG 2.
IAV surveillance in U.S. exhibition swine in 2018. (A) Each circle represents one of the 113 swine exhibitions from which respiratory samples obtained from pigs and tested for IAV. The color of the point indicates whether the exhibition was IAV positive (red) or negative (gray) by virus isolation. Large points represent larger shows (state fairs and national or regional jackpot shows); small points represent smaller shows (local jackpot or county fairs). (B) Each box represents a swine show that was sampled for this study, including county fairs (top; n = 98) and state fairs and jackpot shows (bottom; n = 15). Within each box, the blue shading indicates the proportion of swine that tested positive for IAV by PCR at that individual show. The horizontal dotted blue line indicates 50% of pigs testing positive. A single line below indicates the proportion of all shows of a certain type (county or state/jackpot) that had at least one pig test positive for IAV.

